Week 3: Reading Files, Dictionaries, Stats#
Recap#
Last lecture, we learned about:
Lists
String methods
Loops
# Discuss with your neighbors to write comments for each line of the following code.
# In particular, what values does "word" take on?

sentence = "Measures of central tendency are summary statistics that represent the center point or typical value of a dataset."

words = sentence.split()

long_words = []

for word in words:

    if len(word) > 4:

        long_words.append(word)

print(long_words)
This week#
Our topics for this week are:
How to read csv files
Storing data from a file into a list
Introducing dictionaries: storing key, value pairs
Introducing central tendency and dispersion statistics
Reading data from files#
So far, we’ve been working entirely with data we defined inside our notebook.
But in practice, we’ll be reading in large quantities of data from files. Let’s learn how to do this in JupyterHub and Python!
Running example: Canada’s Electoral Districts#
Today we’ll work with a small dataset of Canada’s 338 electoral districts, sourced from Elections Canada.
We’ve downloaded this data in a file called ED-Canada_2016.csv and added it to course website in the same folder as this notebook.
Let’s take a look now. The easiest way to get to the file is to go to File -> Open… in the menu. Demo time!
CSV files#
ED-Canada_2016.csv is a type of file called a comma-separated values (CSV) file, which is a common way of storing tabular data.
In a CSV file:
Each line of the file represents one row
Within one line, each column entry is separated by a comma
Reading file data: open and readlines#
Now that we’ve seen the file, let’s learn how to read the file’s contents into Python.
Formally, we do this in two steps:
Open the file.
Read the file data into Python, line by line.
# Step 1
district_file = open("ED-Canada_2016.csv", encoding="utf-8")

district_file
district_data = district_file.readlines()

district_data
# You will often see these two operations chained together
district_data = open("ED-Canada_2016.csv", encoding="utf-8").readlines()
district_data
Data processing#
Let’s look at just the first line from the file:
district_data[0]
There’s two annoying parts about this line:
It’s a single string, but really stores two pieces of data.
There’s a strange
\nat the end of the string, representing a line break.
Goal: take the list district_data and extract just the population counts, converting to int. We’ll develop this one together!
# Write this code in class.
Now we can compute!#
num_populations = len(populations)
total_population = sum(populations)
max_population = max(populations)
min_population = min(populations)
avg_population = total_population / num_populations

print(f"Number of population entries: {num_populations}")
print(f"Sum of populations: {total_population}")
print(f"Maximum district population: {max_population}")
print(f"Minimum district population: {min_population}")
print(f"Average district population: {avg_population}")
Dictionaries#
It’s kind of worrying to have just a list of numbers without any label for what the numbers mean. There is a Python data structure that is more useful for associating labels with values called a dictionary. As you will see it is similar to a list, but instead of a sequential index to access values, we think of a dictionary as containing key value pairs.
Using the district_data lines that we read from ED-Canada_2016.csv, let’s see how we can build a dictionary with this data instead of a list of populations:
# create an empty dictionary
district_populations_dict = {}
for line in district_data:
    entries = line.split(",")

    district_name = entries[0].strip()
    population_entry = entries[1].strip()
    population_int = int(population_entry)

    district_populations_dict[district_name] = population_int

print(district_populations_dict)
Now let’s use the dictionary to compute the same values as above#
# These are not great variable names, but I wante to create new names rather
# than repeat the ones from above to avoid confusion.
num_districts = len(district_populations_dict)
total_population_dict = sum(district_populations_dict.values())
max_population_dict = max(district_populations_dict.values())
min_population_dict = min(district_populations_dict.values())
avg_population_dict = total_population_dict / num_districts

print(f"Number of population entries: {num_districts}")
print(f"Sum of populations: {total_population_dict}")
print(f"Maximum district population: {max_population_dict}")
print(f"Minimum district population: {min_population_dict}")
print(f"Average district population: {round(avg_population_dict)}")
Dictionary Keys#
There is a dictionary method to get the list of keys in the dictionary: dict.keys() In our example, this would be district_populations_dict.keys(). This is particularly useful because the most common way of looping over a dictionary is iterating over the keys. This is so common that there is kind of a short cut for this.
We could also have used district_populations_dict.keys() instead of district_populations_dict below to get the list of keys.
# the short hand for looping over the keys of a dictionary.
for district in district_populations_dict:
    print(district)
Exercise Break#
Let’s put some of this together. Print the following message for each district that has Toronto in its name. Use district_populations_dict that was defined above.
f"{name} has population {district_populations[name]}
In English what we want to do is check each dictionary key to see if the string Toronto is in the key. If it is, then we will print the message.
# write your code here
Central Tendency#
This is a fancy way of saying that when you have some data, you would like to be able to summarize it. In particular we would like to say something about the central value or the typical value of the data set. The three most common measures of central tendency are mean (average), median, and mode.
Mean - The arithmetic average, calculated by summing up all the numbers in a data set and dividing by the number of data points.
Median - The middle value when data is sorted. If the number of data points is even, then the median is the average of the two middle values.
Mode - The most frequently occuring value. Useful for categorical data such as likert scale data.
# Calculating Mean
grades = [47.6, 73.2, 85.4, 54.9, 97.6, 26.8, 0.0, 85.4, 96.3, 82.9, 0.0, 0.0, 90.2, 0.0, 0.0, 0.0, 92.7, 47.6, 31.7, 86.6, 95.1, 90.2, 92.7, 54.9, 95.1, 0.0, 82.9, 84.1, 81.7, 87.8, 85.4, 46.3, 92.7, 96.3, 73.2, 92.7, 54.9, 57.3, 93.9, 95.1, 85.4, 0.0, 98.8, 92.7, 100.0, 73.2, 82.9, 90.2, 72.0, 85.4, 51.2, 92.7, 48.8, 0.0, 89.0, 17.1, 53.7, 95.1, 96.3, 89.0, 89.0, 61.0, 95.1, 0.0, 0.0, 0.0, 97.6, 90.2, 64.6, 69.5, 85.4, 81.7, 63.4, 90.2, 95.1, 86.6, 90.2, 0.0, 84.1, 39.0, 0.0, 48.8, 78.0, 47.6, 0.0, 86.6, 97.6, 0.0, 86.6, 0.0, 61.0, 0.0, 91.5, 100.0, 90.2, 95.1, 87.8, 0.0, 87.8, 92.7, 75.6, 63.4, 97.6, 69.5, 80.5, 68.3, 48.8, 0.0, 87.8, 79.3, 70.7, 97.6, 90.2, 62.2, 84.1, 79.3, 97.6, 35.4, 80.5, 0.0, 80.5, 78.0, 96.3, 97.6, 90.2, 95.1, 0.0, 75.6, 0.0]

mean = round(sum(grades) / len(grades), 1)

print(f"The mean grade is {mean}")
# Step 1: sort the data
grades_sorted = sorted(grades)

n = len(grades_sorted)
mid = n // 2

# Step 2: compute the median
if n % 2 == 1:
    median = grades_sorted[mid]
else:
    median = (grades_sorted[mid - 1] + grades_sorted[mid]) / 2

print(f"The median grade is {median}")
# Calculate Mode

favourite_season = ['Fall', 'Summer', 'Summer', 'Summer', 'Fall', 'Summer', 'Summer', 'Fall', 'Summer', 'Fall', 'Summer', 'Fall', 'Fall', 'Spring', 'Summer', 'Spring', 'Winter', 'Fall', 'Fall', 'Summer', 'Spring', 'Summer', 'Winter', 'Summer', 'Summer', 'Winter', 'Spring', 'Spring', 'Summer', 'Fall', 'Fall', 'Spring', 'Fall', 'Summer', 'Summer', 'Summer', 'Spring', 'Fall', 'Spring', 'Summer', 'Fall', 'Spring', 'Winter', 'Spring', 'Summer', 'Fall', 'Summer', 'Summer', 'Winter', 'Spring', 'Fall', 'Fall', 'Fall', 'Summer', 'Fall', 'Fall', 'Fall', 'Summer', 'Summer', 'Fall', 'Summer', 'Spring']

# Step 1: count occurrences
counts = {}

for season in favourite_season:
    # if season is already a key in the counts dictionary
    if season in counts:
        counts[season] += 1
    else:
        counts[season] = 1

print(counts)
# Step 2: find the mode
mode = None
max_count = 0

for season, count in counts.items():
    if count > max_count:
        max_count = count
        mode = season

print(f"Most people's favourite season is {mode}")
Skew#
If the mean and median are very close or the same, then the data has a symmetrical distribution. In fact, the mode will also be very close to the mean and median.
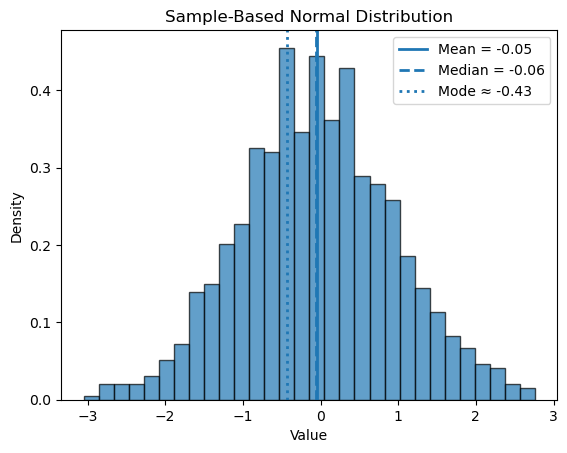
However, if the mean and median differ then the data is skewed, and the more skewed the distribution the greater the difference between the mean and the median.
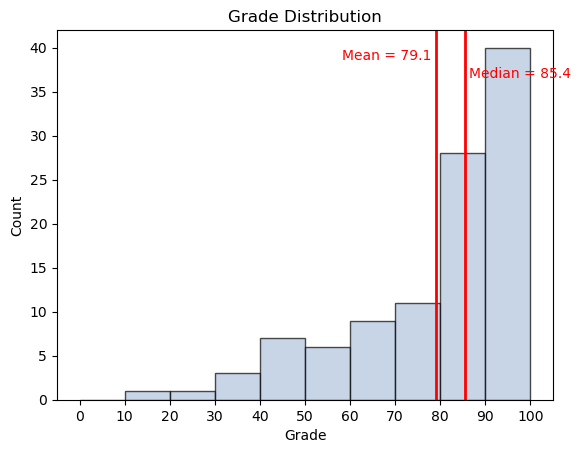
For example, suppose that you learned that the average on the midterm was 79%, and your grade was 80%. How would you feel about it?
Now what if you learned that the median was 85%?
In other words, half the class received a grade higher than 85%.
Let’s look at this histogram:
Here is one more thought about what the data really means. Consider the following histogram. I imagine you might be quite grumpy to be told that the average grade on the final exam was 57%! But there is something else going on here.
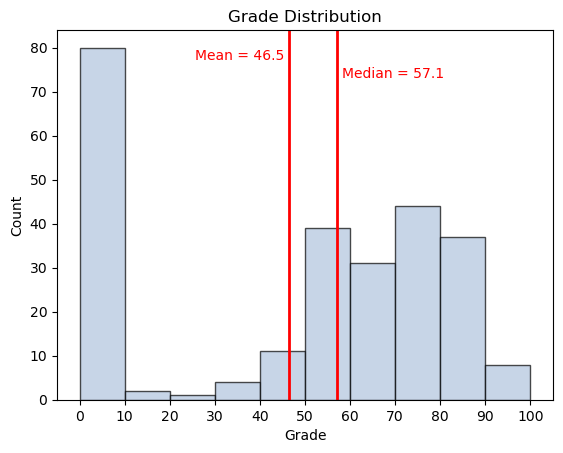
Let’s look at the data again with the zeros removed. These are the same grades as in the previous graph but with all the zeros removed. Now the mean and the median are very close, and the data distribution is more meaningful.