
GGR274H1 Final Project Data Guide#
This notebook lays out instructions for reading the data files for the final project, all of which are contained with the data folder on JupyterHub.
These datasets provide information at the level of Toronto neighbourhoods, which are used to track population and health dynamics across different parts of the city.
# Loading necessary packages

import pandas as pd
import geopandas as gpd
import folium
Neighbourhoods#
Check out the interactive map produced in the code block below - hover over individual neighbourhoods to get their name and ID number. This will give you a sense of how each neighbourhood is defined!
## Code for creating interactive neighbourhood map

neighbourhoods = gpd.read_file("data/Neighbourhoods.geojson")

neighbourhood_map = folium.Map(location=[43.73, -79.39], zoom_start=11, tiles='OpenStreetMap', max_zoom=19)

folium.GeoJson(neighbourhoods, tooltip=folium.GeoJsonTooltip(fields=['AREA_DESC'])).add_to(neighbourhood_map)

neighbourhood_map
Data Inventory#
The full inventory of available data files available in the course repository is as follows:
Spatial Data:
Neighbourhoods.geojson: Information about the shape and location of each Toronto neighbourhood, as shown in the map above (will be useful for mapping your data later)
Demographic/Socioeconomic Data:
population_characteristics_Toronto_2021_7.xlsx: Basic population characteristics by Toronto neighbourhoodincome_Toronto_2021_7.xlsx: Basic characteristics of low-income population by Toronto neighbourhood. Includes:LICO-AT: Definition of low-income population based on being able to afford essentials (food, shelter, clothing) after taxesLIM-AT: Definition of low-income population based on 50% of the median household income after taxes
housing_dwellings_Toronto_2021_7.xlsx: Basic housing characteristics by Toronto neighbourhood
Health-Related Data:
AHD_Asthma_FY2022.xlsx: Prevalence of asthma by Toronto neighbourhoodAHD_CHF_202223.xlsx: Prevalence of congestive heart failure by Toronto neighbourhoodAHD_COPD_FY2023.xlsx: Prevlance of chronic obstructive pulmonary disease (COPD) by Toronto neighbourhoodAHD_DiabetesAHD_Diabetes_FY2022.xlsx: Prevalence of diabetes by Toronto neighbourhoodAHD_HBP_FY2022.xlsx: Prevalence of high blood pressure by Toronto neighbourhood
Reading Excel Files#
Unlike the files we’ve mainly used in class, most of the data files listed above are Excel spreadsheets (.xlsx). This requires a slightly different approach to normal, because Excel spreadsheets tend to have a more complex structure.
Let’s use the file population_characteristics_Toronto_2021_7.xlsx as an example.
Finding Sheet Names#
Many excel spreadsheets contain multiple individual sheets - independent tables contained within the same file.
You can obtain the names of sheets within an Excel file by pulling in the file metadata via pd.ExcelFile(), and then look at the .sheet_names characteristic of this metadata
population_metadata = pd.ExcelFile("data/population_characteristics_Toronto_2021_7.xlsx")

population_metadata.sheet_names
['Official Languages',
 'Immigrant Status',
 'Generation Status',
 'Visible Minority_REVISED']
This Excel file contains four tables:
Official LanguagesImmigrant StatusGeneration StatusVisible Minority_REVISED
Reading Data#
You can read data from a specific sheet using the function pd.read_excel() by providing a sheet_name. For this example, we’ll look at “Official Languages”.
language_data = pd.read_excel("data/population_characteristics_Toronto_2021_7.xlsx", sheet_name = "Official Languages")

language_data.head(10)
| Unnamed: 0 | 2021 Census of Population - Socio-Demographic Variables (Persons - Knowledge of Official Languages) - City of Toronto Neighbourhoods | Unnamed: 2 | Unnamed: 3 | Unnamed: 4 | Unnamed: 5 | Unnamed: 6 | Unnamed: 7 | Unnamed: 8 | Unnamed: 9 | Unnamed: 10 | |
|---|---|---|---|---|---|---|---|---|---|---|---|
| 0 | The data sets used to calculate these statist... | NaN | NaN | NaN | NaN | NaN | NaN | NaN | NaN | NaN | NaN |
| 1 | The sum of component statistics (e.g. "Englis... | NaN | NaN | NaN | NaN | NaN | NaN | NaN | NaN | NaN | NaN |
| 2 | City of Toronto counts are from Census Subdiv... | NaN | NaN | NaN | NaN | NaN | NaN | NaN | NaN | NaN | NaN |
| 3 | Refer to Statistics Canada's website or meta-... | NaN | NaN | NaN | NaN | NaN | NaN | NaN | NaN | NaN | NaN |
| 4 | ^ Refers to Total - Knowledge of official lan... | NaN | NaN | NaN | NaN | NaN | NaN | NaN | NaN | NaN | NaN |
| 5 | Any calculations using values between 5 and 2... | NaN | NaN | NaN | NaN | NaN | NaN | NaN | NaN | NaN | NaN |
| 6 | Statistics Canada randomly rounds all reporte... | NaN | NaN | NaN | NaN | NaN | NaN | NaN | NaN | NaN | NaN |
| 7 | ©Ontario Community Health Profiles Partnershi... | NaN | NaN | NaN | NaN | NaN | NaN | NaN | NaN | NaN | NaN |
| 8 | NaN | NaN | NaN | NaN | NaN | NaN | NaN | NaN | NaN | NaN | NaN |
| 9 | Neighb ID | Neighbourhood Name | Total - Population with knowledge of official ... | Population with knowledge of English only | Population with knowledge of English only (%) | Population with knowledge of French only | Population with knowledge of French only (%) | Population with knowledge of English & French | Population with knowledge of English & French... | Population with knowledge of neither English n... | Population with knowledge of neither English n... |
That didn’t work!
You must also provide the index of a “header” row - the row where the column names can be found.
In a normal table, the header would be 0. However, many of these excel spreadsheets contain informational text in the first several rows, which is not real data.
In the screenshot below from Excel, we can see that the data table actually starts in row 11. Therefore, the index of our header is 10 (remember - python indexes start at 0 even though Excel spreadsheets start their row numbers at 1, so you need to subtract 1!)

language_data = pd.read_excel("data/population_characteristics_Toronto_2021_7.xlsx", sheet_name = "Official Languages", header = 10)

language_data.head(10)
| Neighb ID | Neighbourhood Name | Total - Population with knowledge of official languages^ | Population with knowledge of English only | Population with knowledge of English only (%) | Population with knowledge of French only | Population with knowledge of French only (%) | Population with knowledge of English & French | Population with knowledge of English & French (%) | Population with knowledge of neither English nor French | Population with knowledge of neither English nor French (%) | |
|---|---|---|---|---|---|---|---|---|---|---|---|
| 0 | 1.0 | West Humber-Clairville | 33450 | 30915 | 92.4 | 10 | 0.0 | 1115 | 3.3 | 1375 | 4.1 |
| 1 | 2.0 | Mount Olive-Silverstone-Jamestown | 31330 | 28105 | 89.7 | 20 | 0.1 | 1045 | 3.3 | 2175 | 6.9 |
| 2 | 3.0 | Thistletown-Beaumond Heights | 9850 | 8905 | 90.4 | 0 | 0.0 | 430 | 4.4 | 520 | 5.3 |
| 3 | 4.0 | Rexdale-Kipling | 10380 | 9570 | 92.2 | 15 | 0.1 | 515 | 5.0 | 295 | 2.8 |
| 4 | 5.0 | Elms-Old Rexdale | 9365 | 8640 | 92.3 | 5 | 0.1 | 420 | 4.5 | 295 | 3.2 |
| 5 | 6.0 | Kingsview Village-The Westway | 22010 | 19795 | 89.9 | 25 | 0.1 | 1410 | 6.4 | 800 | 3.6 |
| 6 | 7.0 | Willowridge-Martingrove-Richview | 22455 | 20405 | 90.9 | 35 | 0.2 | 1445 | 6.4 | 585 | 2.6 |
| 7 | 8.0 | Humber Heights-Westmount | 10285 | 9205 | 89.5 | 0 | 0.0 | 710 | 6.9 | 390 | 3.8 |
| 8 | 9.0 | Edenbridge-Humber Valley | 15465 | 13665 | 88.4 | 0 | 0.0 | 1435 | 9.3 | 360 | 2.3 |
| 9 | 10.0 | Princess-Rosethorn | 11170 | 9780 | 87.6 | 0 | 0.0 | 1205 | 10.8 | 175 | 1.6 |
You will need to check the header index for each table you read - it won’t necessarily be the same for every file or sheet!
The very next sheet in this same file, “Immigrant Status”, has its header starting in row 10. Therefore, we should put header = 9.
immigrant_data = pd.read_excel("data/population_characteristics_Toronto_2021_7.xlsx", sheet_name = "Immigrant Status", header = 9)

immigrant_data.head(10)
| Neighb ID | Neighbourhood Name | Total Population^ | Population who are Immigrants | Population who are Immigrants (%) | Population who Received Immigration Status Between 2011-2021 | Population who Received Immigration Status Between 2011-2021 (%) | Population who Received Immigration Status Between 2011-2015 | Population who Received Immigration Status Between 2011-2015 (%) | Population who Received Immigration Status Between 2016-2021 | Population who Received Immigration Status Between 2016-2021 (%) | Population who are Non-Permanent Residents | Population who are Non-Permanent Residents (%) | Population who are Non-Immigrants | Population who are Non-Immigrants (%) | |
|---|---|---|---|---|---|---|---|---|---|---|---|---|---|---|---|
| 0 | 1.0 | West Humber-Clairville | 33280 | 18800 | 56.5 | 4410 | 13.3 | 2050 | 6.2 | 2310 | 6.9 | 2630 | 7.9 | 11800 | 35.5 |
| 1 | 2.0 | Mount Olive-Silverstone-Jamestown | 31335 | 19780 | 63.1 | 6760 | 21.6 | 3280 | 10.5 | 3455 | 11.0 | 1895 | 6.0 | 9615 | 30.7 |
| 2 | 3.0 | Thistletown-Beaumond Heights | 9845 | 5210 | 52.9 | 1040 | 10.6 | 390 | 4.0 | 655 | 6.7 | 555 | 5.6 | 4035 | 41.0 |
| 3 | 4.0 | Rexdale-Kipling | 10370 | 4810 | 46.4 | 1110 | 10.7 | 545 | 5.3 | 525 | 5.1 | 430 | 4.1 | 5070 | 48.9 |
| 4 | 5.0 | Elms-Old Rexdale | 9360 | 4595 | 49.1 | 995 | 10.6 | 510 | 5.4 | 480 | 5.1 | 215 | 2.3 | 4510 | 48.2 |
| 5 | 6.0 | Kingsview Village-The Westway | 22010 | 11145 | 50.6 | 3045 | 13.8 | 1290 | 5.9 | 1710 | 7.8 | 665 | 3.0 | 10145 | 46.1 |
| 6 | 7.0 | Willowridge-Martingrove-Richview | 22450 | 10270 | 45.7 | 2095 | 9.3 | 850 | 3.8 | 1120 | 5.0 | 595 | 2.7 | 11495 | 51.2 |
| 7 | 8.0 | Humber Heights-Westmount | 10010 | 4705 | 47.0 | 665 | 6.6 | 395 | 3.9 | 240 | 2.4 | 120 | 1.2 | 5085 | 50.8 |
| 8 | 9.0 | Edenbridge-Humber Valley | 15190 | 5900 | 38.8 | 1060 | 7.0 | 440 | 2.9 | 550 | 3.6 | 240 | 1.6 | 9045 | 59.5 |
| 9 | 10.0 | Princess-Rosethorn | 11170 | 3390 | 30.3 | 510 | 4.6 | 225 | 2.0 | 225 | 2.0 | 110 | 1.0 | 7615 | 68.2 |
Nested Headers#
For the health datasets, there is another complication: they have multiple nested headers! For example, look at AHD_Asthma_FY2022.xlsx:
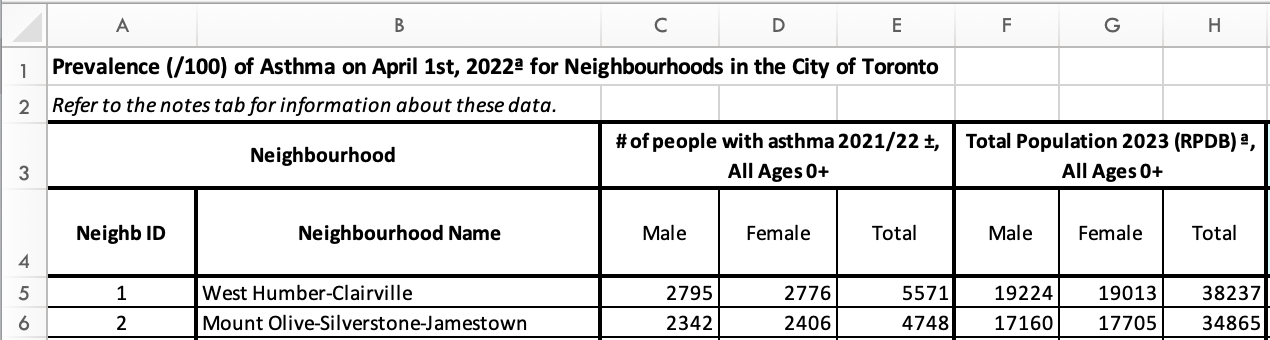
For example, the first header in row 3 # of people with asthma 2021/22 ±, All Ages 0+ is divided into Male, Female, and Total in row 4!
To resolve this, list the indexes of both rows (2 and 3) as header:
asthma_data = pd.read_excel("data/AHD_Asthma_FY2022.xlsx", sheet_name = "Asthma_NHsTOR", header = [2, 3])

asthma_data.head(10)
| Neighbourhood | # of people with asthma 2021/22, All Ages 0+ | Total Population 2023 (RPDB), All Ages 0+ | Age-Standardized rate (/100) of Asthma (2021/22), All Ages 0+ | ... | Prevalence (/100) of Asthma (2021/22), Age 65+ | ||||||||||||||||
|---|---|---|---|---|---|---|---|---|---|---|---|---|---|---|---|---|---|---|---|---|---|
| Neighb ID | Neighbourhood Name | Male | Female | Total | Male | Female | Total | Male | Female | ... | Female | Total | Rate Ratio**, Total | H/ L/ NS, \nTotal | (95% CI) LL, Male | (95% CI) UL, Male | (95% CI) LL, Female | (95% CI) UL, Female | (95% CI) LL, Total | (95% CI) UL, Total | |
| 0 | 1.0 | West Humber-Clairville | 2795 | 2776 | 5571 | 19224 | 19013 | 38237 | 14.4 | 14.5 | ... | 19.0 | 17.0 | 1.15 | H | 13.5 | 16.1 | 17.6 | 20.3 | 16.1 | 17.9 |
| 1 | 2.0 | Mount Olive-Silverstone-Jamestown | 2342 | 2406 | 4748 | 17160 | 17705 | 34865 | 13.3 | 13.7 | ... | 17.7 | 15.9 | 1.07 | NS | 12.4 | 15.2 | 16.2 | 19.2 | 14.8 | 16.9 |
| 2 | 3.0 | Thistletown-Beaumond Heights | 838 | 889 | 1727 | 5661 | 5778 | 11439 | 14.6 | 15.2 | ... | 18.9 | 17.6 | 1.19 | H | 13.9 | 18.5 | 16.6 | 21.2 | 16.0 | 19.3 |
| 3 | 4.0 | Rexdale-Kipling | 892 | 921 | 1813 | 5721 | 5809 | 11530 | 15.8 | 15.7 | ... | 17.9 | 16.0 | 1.08 | NS | 11.5 | 15.7 | 15.7 | 20.0 | 14.5 | 17.5 |
| 4 | 5.0 | Elms-Old Rexdale | 938 | 898 | 1836 | 5158 | 5146 | 10304 | 18.0 | 17.4 | ... | 17.8 | 15.7 | 1.06 | NS | 10.8 | 15.6 | 15.2 | 20.4 | 13.9 | 17.5 |
| 5 | 6.0 | Kingsview Village-The Westway | 2137 | 2245 | 4382 | 12776 | 13006 | 25782 | 16.5 | 17.2 | ... | 17.4 | 14.6 | 0.99 | NS | 9.9 | 12.7 | 15.8 | 18.9 | 13.6 | 15.7 |
| 6 | 7.0 | Willowridge-Martingrove-Richview | 1849 | 2026 | 3875 | 11556 | 12404 | 23960 | 16.2 | 16.1 | ... | 18.4 | 16.1 | 1.09 | H | 11.6 | 14.3 | 17.0 | 19.7 | 15.1 | 17.0 |
| 7 | 8.0 | Humber Heights-Westmount | 819 | 1011 | 1830 | 5163 | 5995 | 11158 | 16.5 | 16.8 | ... | 17.8 | 15.7 | 1.06 | NS | 10.6 | 14.4 | 16.0 | 19.5 | 14.4 | 17.0 |
| 8 | 9.0 | Edenbridge-Humber Valley | 1164 | 1373 | 2537 | 7878 | 9024 | 16902 | 15.4 | 15.3 | ... | 15.6 | 13.8 | 0.93 | NS | 9.8 | 12.7 | 14.2 | 17.0 | 12.7 | 14.8 |
| 9 | 10.0 | Princess-Rosethorn | 875 | 878 | 1753 | 5999 | 6227 | 12226 | 15.2 | 14.2 | ... | 13.7 | 12.0 | 0.81 | L | 8.3 | 11.7 | 11.9 | 15.5 | 10.7 | 13.2 |
10 rows × 98 columns
To reference a specific column, you need to include the names of both the first and second headers in separate [] brackets.
asthma_data["# of people with asthma 2021/22, All Ages 0+"]["Total"]
0        5571
1        4748
2        1727
3        1813
4        1836
        ...
154      3940
155      2052
156      1725
157      2746
158    413952
Name: Total, Length: 159, dtype: int64
Have fun exploring!#
##