Additional Tips and Tricks on Creating#
This notebook has examples on how to
Split cells so that two or more cells appear on the same slide
Change font size, colour, and style. More information is available here.
Splitting cells and Hiding Output (Not available this term)#
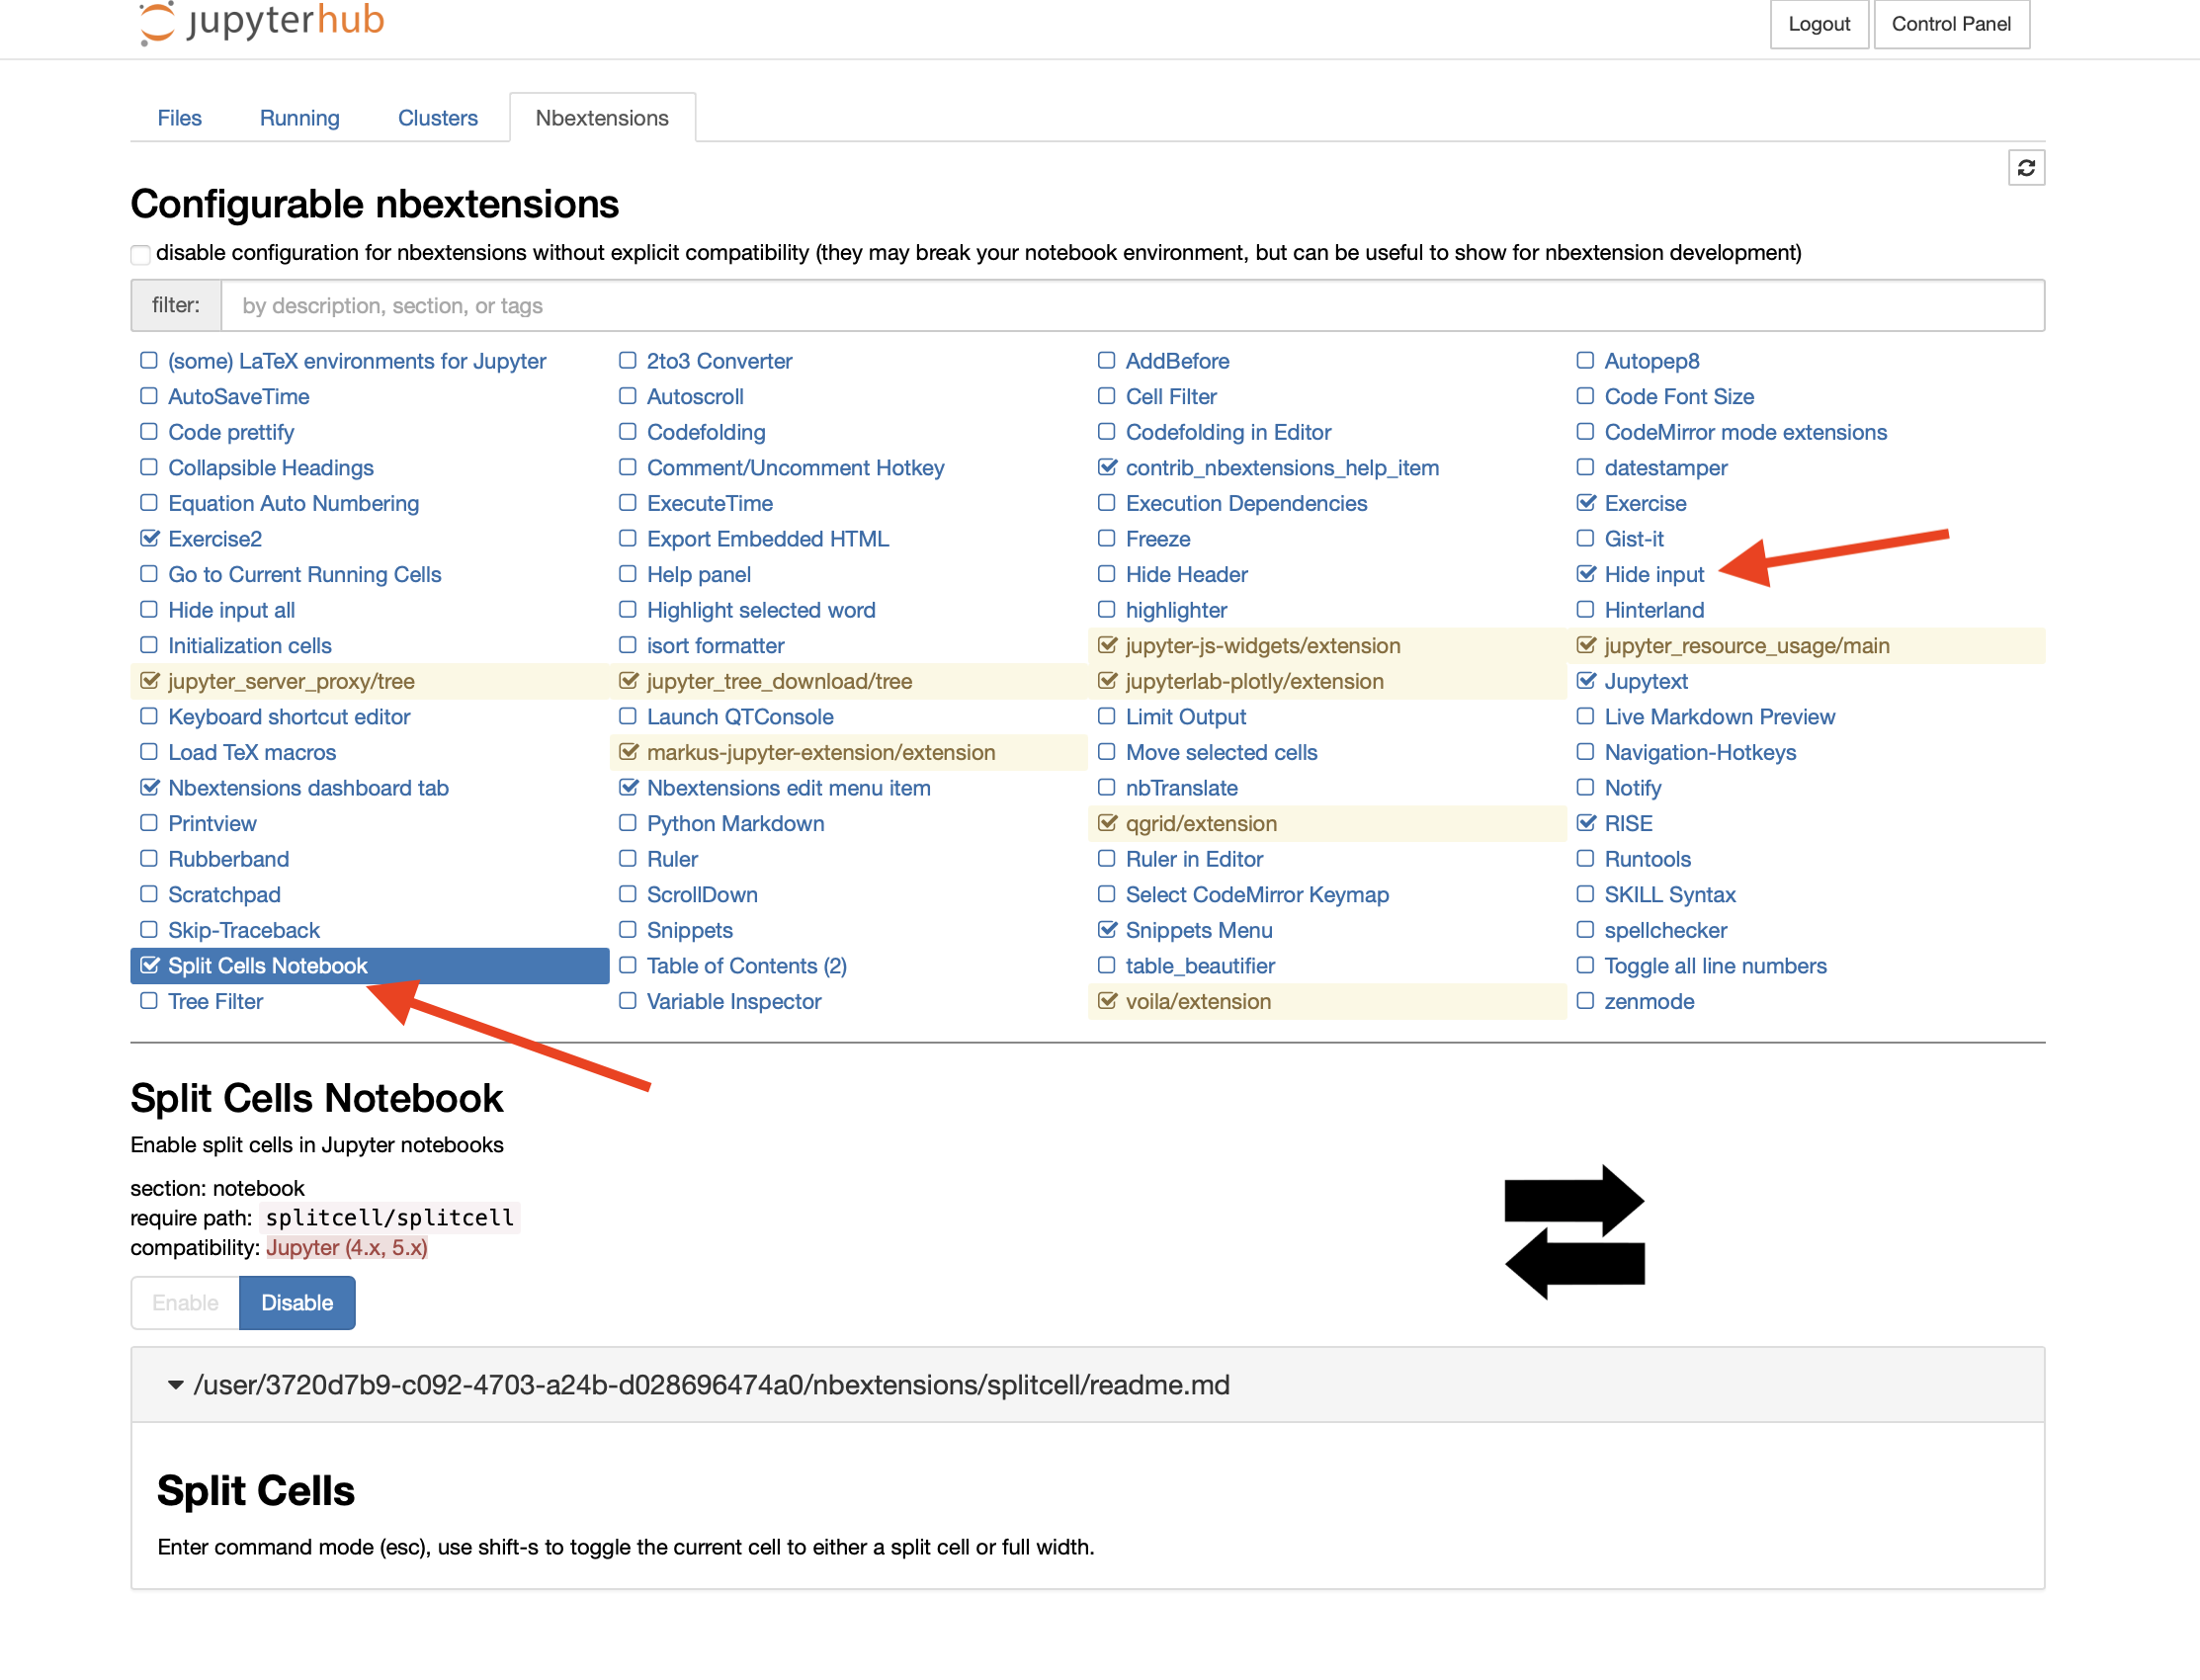
Enable the nbextensions Split Cells Notebook and Hide input

On jupyter.utoronto.ca open a jupyter notebook or refresh the page of an open notebook and you should see the following icon on the toolbar.

Select a cell that you would like to split (i.e, put on left-hand or right-hand part of the screen) then click Split Cell icon on the tool bar.
The examples below show how splitting cells can be combined with hiding code and Slide Type.
Change font colour#
This text is blue.
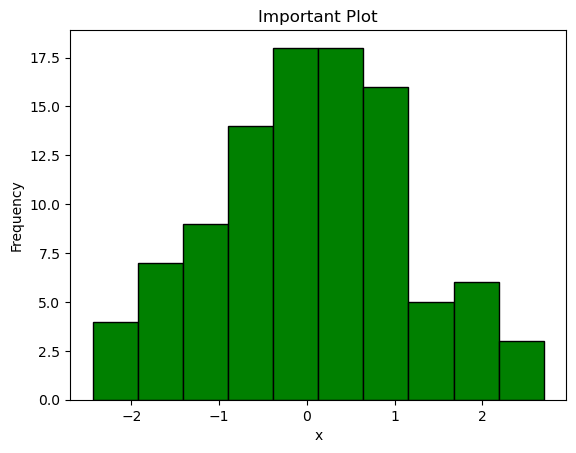
Look at the plot to the right. Notice that the code is hidden (currently not available).
Change font size#
This text is 12px.
This text is 16px.
This text is 18px.
This text is 36px.
import numpy as np
import matplotlib.pyplot as plt

data = np.random.normal(0,1,100)

plt.hist(data, color="green", edgecolor="black")
plt.xlabel('x')
plt.ylabel('Frequency')
plt.title('Important Plot');

Another Section#
another bullet point
bullet point 1
bullet point 2
bullet point 3
x = 10
important_msg = f'The value is {x}'
important_msg
'The value is 10'
Combine font size and colour#
This text is green.
Font Style#
This is italic
This is oblique
Combine font size, colour, and style#
This is italic
This is italic
## this slide has additional analysis that I haven't shown in my presentation
