Lecture 4: Introduction to pandas and Data Wrangling#
Introduction to working with (tabular) data using
pandasImport a csv file into a
pandasDataFrame
Selecting rows of a DataFrame
Selecting columns of a DataFrame
Computing summary statistics on a DataFrame
pandas#
pandasis a python package that makes it easy to work with tabular data.What is tabular data?
Data Example 1#
Is this data tabular?
Data Example 2#
Is this data tabular?

Text is taken from the Stanford Encyclopedia of Philosophy.
Data Example 3#
Is this data tabular?

Source: https://health-infobase.canada.ca/canadian-risk-factor-atlas/
Data Example 4#
Is this data tabular?
Raw Data#
The data in Example 4 is from
Is this raw data?
What is this data’s provenance?
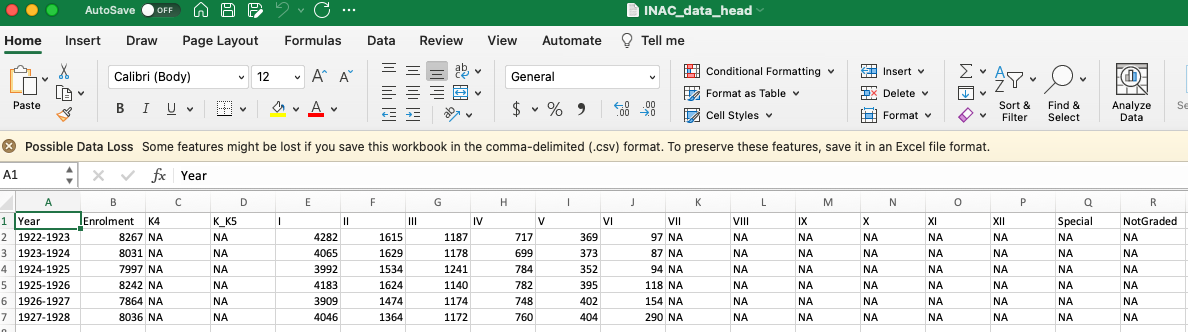
Comma Separated Value (csv) Files#
A csv file is a text file that uses a comma (this is an example of a delimiter) to separate values.
id, person, department
0, Michael Moon, STA
1, Karen Reid, DCS
2, Chunjiang Li, GGR
csv files often have a “.csv” extension as part of the file name. For example,
GGR274faculty.csv.Spreadsheet programs such as Excel are often used to create, read, and store csv files. But, any program (e.g., Jupyter notebooks) that can manage text files can do the same.
What It Takes to Read a csv File#
{
    "id": [0, 1, 2],
    "person": ["Michael Moon", "Karen Reid", "Chunjiang Li"],
    "department": ["STA", "DCS", "GGR"]
}
To read the
GGR274faculty.csvinto a dictionary as shown above, you would write a code similar:
faculty_csv = open("GGR274faculty.csv", encoding="utf-8")
faculty_data = faculty_csv.readlines()
ids = []
persons = []
departments = []


for line in faculty_data[1:]: #
    entries = line.split(",")
    # read, parse, and store the id
    id_entry = entries[0].strip()
    id_int = int(id_entry)
    ids.append(id_int)
    # read and store the person name
    person_entry = entries[1].strip()
    persons.append(person_entry)
    # read and store the department
    department_entry = entries[2].strip()
    departments.append(department_entry)

# store the data in a dictionary
faculty = {}
faculty["id"] = ids
faculty["person"] = persons
faculty["department"] = departments

print(faculty)
{'id': [0, 1, 2], 'person': ['Michael Moon', 'Karen Reid', 'Chunjiang Li'], 'department': ['STA', 'DCS', 'GGR']}
Or, we can use
pandas
import pandas as pd
faculty = pd.read_csv("GGR274faculty.csv")
faculty
/var/folders/0j/ybsv4ncn5w50v40vdh5jjlww0000gn/T/ipykernel_13146/3023373319.py:1: DeprecationWarning:
Pyarrow will become a required dependency of pandas in the next major release of pandas (pandas 3.0),
(to allow more performant data types, such as the Arrow string type, and better interoperability with other libraries)
but was not found to be installed on your system.
If this would cause problems for you,
please provide us feedback at https://github.com/pandas-dev/pandas/issues/54466

  import pandas as pd
| id | person | department | |
|---|---|---|---|
| 0 | 0 | Michael Moon | STA |
| 1 | 1 | Karen Reid | DCS |
| 2 | 2 | Chunjiang Li | GGR |
pandas#
pandasis a Python package and is the “fundamental high-level building block for doing practical, real-world data analysis in Python” (see pandas Getting started).We will study and use the primary data structures of pandas,
Series(1-dimensional) andDataFrame(2-dimensional).
Import pandas#
First import the pandas package.
import pandas
This will allow us to access functions and methods in the pandas package in our Jupyter notebook. But, we can use the Python keyword as to abbreviate pandas.
import pandas as pd
Create a pandas Series from a List#
people = ["Michael Moon", "Karen Reid", "Chunjiang Li"]

faculty_series = pd.Series(people)

faculty_series
0    Michael Moon
1      Karen Reid
2    Chunjiang Li
dtype: object
dept = ["STA", "DCS", "GGR"]

department_series = pd.Series(dept)

department_series
0    STA
1    DCS
2    GGR
dtype: object
# a pd.Series can do what a list can do!
print(len(department_series))

print(department_series[0])
3
STA
Creating a Boolean Series based on a Condition#
Create a Series where the element is True if department_series is equal to STA and False otherwise.
department_series = pd.Series(dept)

department_series
0    STA
1    DCS
2    GGR
dtype: object
department_series == "STA"
0     True
1    False
2    False
dtype: bool
Create a Series where the element is True if department_series is equal to GGR and False otherwise.
print(department_series)

department_series == "GGR"
0    STA
1    DCS
2    GGR
dtype: object
0    False
1    False
2     True
dtype: bool
Create a Series where the element is True if department_series is equal to STA OR GGR and False otherwise.
print(department_series)

(department_series == "STA") | (department_series == "GGR")
0    STA
1    DCS
2    GGR
dtype: object
0     True
1    False
2     True
dtype: bool
Create a Series where the element is True if department_series is equal to STA AND GGR and False otherwise.
print(department_series)

(department_series == "STA") & (department_series == "GGR")
0    STA
1    DCS
2    GGR
dtype: object
0    False
1    False
2    False
dtype: bool
Create a Series where the element is
True if
department_series equal to STA
is NOT EQUAL to
department_series equal to GGR,
and False otherwise (this is tricky 😨)
print(department_series)

# (equal to "STA")      not equal to       (equal to "GGR")
(department_series == "STA") != (department_series == "GGR")

# TRY!
0    STA
1    DCS
2    GGR
dtype: object
0     True
1    False
2     True
dtype: bool
Boolean logic with pandas Series#
When comparing Boolean Series in pandas we use different logical operators
Series1 = pd.Series([True, False, True])
Series2 = pd.Series([False, False, True])
Operation |
Description |
Result of operation in a list |
|---|---|---|
|
|
|
|
|
|
|
|
|
Create a pandas DataFrame using a dictionary#
A dictionary store data in key-value pairs.
A popular way to create a dictionary is to use curly braces {} and colons
:to separate keys and values (key:values)
candy_dict = {"candy": ["red licorice", "caramel apple salt", "cherry sours"]}
the key of
candy_dictis “candy”the values of
candyare:"red licorice", "caramel apple salt", "cherry sours"
candy_dict = {"candy": ["red licorice", "caramel apple salt", "cherry sours"]}
type(candy_dict)
dict
We can create a dict of GGR274 course faculty.
data = {"academic department" : ["STA", "DCS", "GGR"],
        "faculty": ["Michael Moon", "Karen Reid", "Chunjiang Li"],
        "favourite candy": ["red licorice", "caramel apple salt", "cherry sours"],
        "name length": [len("Michael Moon"), len("Karen Reid"), len("Chunjiang Li")]}

data
{'academic department': ['STA', 'DCS', 'GGR'],
 'faculty': ['Michael Moon', 'Karen Reid', 'Chunjiang Li'],
 'favourite candy': ['red licorice', 'caramel apple salt', 'cherry sours'],
 'name length': [12, 10, 12]}
Let’s store data in a pandas DataFrame.
pd.DataFrame(data)
| academic department | faculty | favourite candy | name length | |
|---|---|---|---|---|
| 0 | STA | Michael Moon | red licorice | 12 |
| 1 | DCS | Karen Reid | caramel apple salt | 10 |
| 2 | GGR | Chunjiang Li | cherry sours | 12 |
Now, let’s store the pandas DataFrame above in a variable called GGR274fac_df.
GGR274fac_df = pd.DataFrame(data)

GGR274fac_df
| academic department | faculty | favourite candy | name length | |
|---|---|---|---|---|
| 0 | STA | Michael Moon | red licorice | 12 |
| 1 | DCS | Karen Reid | caramel apple salt | 10 |
| 2 | GGR | Chunjiang Li | cherry sours | 12 |
Select rows of a DataFrame using a list of True & False values (a.ka. Boolean values)#
Let’s remove the second row.
print(GGR274fac_df)

GGR274fac_df[[True, False, True]]
  academic department       faculty     favourite candy  name length
0                 STA  Michael Moon        red licorice           12
1                 DCS    Karen Reid  caramel apple salt           10
2                 GGR  Chunjiang Li        cherry sours           12
| academic department | faculty | favourite candy | name length | |
|---|---|---|---|---|
| 0 | STA | Michael Moon | red licorice | 12 |
| 2 | GGR | Chunjiang Li | cherry sours | 12 |
What happened?
How can I remove the first row?
GGR274fac_df[[False, True, True]]
| academic department | faculty | favourite candy | name length | |
|---|---|---|---|---|
| 1 | DCS | Karen Reid | caramel apple salt | 10 |
| 2 | GGR | Chunjiang Li | cherry sours | 12 |

Select columns of a DataFrame using a list of Column Names#
The column names in the
DataFrameGGR274fac_dfcan be obtained usinglist().There are other ways to get the column names, but we will focus on this for now.
list(GGR274fac_df)
['academic department', 'faculty', 'favourite candy', 'name length']
To select the column
favourite candywe can add it in quotation marks inside the square brackets[]at the end of theDataFramename.For example: \(\underbrace{\texttt{GGR274fac_df}}_\text{DataFrame Name}\underbrace{\texttt{["favourite candy"]}}_\text{Column Name}\)
GGR274fac_df["favourite candy"]
0          red licorice
1    caramel apple salt
2          cherry sours
Name: favourite candy, dtype: object
my_list_of_column_names = ["favourite candy", "name length"] # throws an error

GGR274fac_df[my_list_of_column_names]
| favourite candy | name length | |
|---|---|---|
| 0 | red licorice | 12 |
| 1 | caramel apple salt | 10 |
| 2 | cherry sours | 12 |
GGR274fac_df[my_list_of_column_names]
is NOT the same as
GGR274fac_df["favourite candy", "name length"]
GGR274fac_df["favourite candy", "name lenth"] # throws an error
# you need to pass a list not multiple strings
---------------------------------------------------------------------------
KeyError                                  Traceback (most recent call last)
File ~/anaconda3/envs/ggr274/lib/python3.10/site-packages/pandas/core/indexes/base.py:3802, in Index.get_loc(self, key)
   3801 try:
-> 3802     return self._engine.get_loc(casted_key)
   3803 except KeyError as err:

File index.pyx:153, in pandas._libs.index.IndexEngine.get_loc()

File index.pyx:182, in pandas._libs.index.IndexEngine.get_loc()

File pandas/_libs/hashtable_class_helper.pxi:7081, in pandas._libs.hashtable.PyObjectHashTable.get_item()

File pandas/_libs/hashtable_class_helper.pxi:7089, in pandas._libs.hashtable.PyObjectHashTable.get_item()

KeyError: ('favourite candy', 'name lenth')

The above exception was the direct cause of the following exception:

KeyError                                  Traceback (most recent call last)
Cell In[58], line 1
----> 1 GGR274fac_df["favourite candy", "name lenth"] # throws an error
      2 # you need to pass a list not multiple strings

File ~/anaconda3/envs/ggr274/lib/python3.10/site-packages/pandas/core/frame.py:4090, in DataFrame.__getitem__(self, key)
   4088 if self.columns.nlevels > 1:
   4089     return self._getitem_multilevel(key)
-> 4090 indexer = self.columns.get_loc(key)
   4091 if is_integer(indexer):
   4092     indexer = [indexer]

File ~/anaconda3/envs/ggr274/lib/python3.10/site-packages/pandas/core/indexes/base.py:3809, in Index.get_loc(self, key)
   3804     if isinstance(casted_key, slice) or (
   3805         isinstance(casted_key, abc.Iterable)
   3806         and any(isinstance(x, slice) for x in casted_key)
   3807     ):
   3808         raise InvalidIndexError(key)
-> 3809     raise KeyError(key) from err
   3810 except TypeError:
   3811     # If we have a listlike key, _check_indexing_error will raise
   3812     #  InvalidIndexError. Otherwise we fall through and re-raise
   3813     #  the TypeError.
   3814     self._check_indexing_error(key)

KeyError: ('favourite candy', 'name lenth')
# a single-element list is still a list and returns DataFrame!
GGR274fac_df[["favourite candy"]]
| favourite candy | |
|---|---|
| 0 | red licorice |
| 1 | caramel apple salt |
| 2 | cherry sours |
GGR274fac_df_column_names = list(GGR274fac_df)

print(f"The list of column names is: {GGR274fac_df_column_names}")
The list of column names is: ['academic department', 'faculty', 'favourite candy', 'name length']
GGR274fac_df_column_names[0]
'academic department'
GGR274fac_df[GGR274fac_df_column_names[0]]
0    STA
1    DCS
2    GGR
Name: academic department, dtype: object
You can select the column number using:
GGR274fac_df[GGR274fac_df_column_names[0]]GGR274fac_df[GGR274fac_df_column_names[3]]
Select rows of a DataFrame#
Rows can be selected from a
DataFrameusing a list of Boolean values.\(\underbrace{\texttt{GGR274fac_df}}_\text{DataFrame Name}\underbrace{\texttt{[[True, False, True]]}}_\text{List of Boolean values}\)
selects the first and third rows of the
DataFramesince the first and third values areTrue. The second row is not selected since the second element of the list isFalse.
my_important_condition = [True, False, True]

my_important_condition
[True, False, True]
GGR274fac_cond = GGR274fac_df[my_important_condition] # select rows

my_important_columns = ["academic department", "faculty"]

GGR274fac_cond[my_important_columns] # select columns
| academic department | faculty | |
|---|---|---|
| 0 | STA | Michael Moon |
| 2 | GGR | Chunjiang Li |
Select rows and columns of a DataFrame#
Combine these two lines of code:
GGR274fac_cond = GGR274fac_df[my_important_condition] # select rows

GGR274fac_cond[my_important_columns] # select columns
to select rows and columns.
GGR274fac_df[my_important_condition][my_important_columns]
| academic department | faculty | |
|---|---|---|
| 0 | STA | Michael Moon |
| 2 | GGR | Chunjiang Li |
Exercise#
Create a pandas DataFrame with three columns:
Your first name and two people sitting close to you – your (new) friends.
The distance from home to the U of T St. George campus for you and your two (new) friends.
The month and day of you and your two (new) friends’ birthday.
# create your DataFrame here.
my_peers = pd.DataFrame({
    "name": ["Michael Moon", "Karen Reid", "Chunjiang Li"],
    "distance to home": ["Far, far, far away", "Pretty far", "Close by"],
    "birth day": ["0101", "0102", "0103"]
})
my_peers
| name | distance to home | birth day | |
|---|---|---|---|
| 0 | Michael Moon | Far, far, far away | 0101 |
| 1 | Karen Reid | Pretty far | 0102 |
| 2 | Chunjiang Li | Close by | 0103 |
Create a pandas DataFrame from a csv file#
Data will usually be stored in a file such as a csv.
It’s very convenient to “read” the file into a pandas
DataFrame, since pandas has many methods that can manipulate tabular data. Otherwise, we could use base python to do these manipulations.
Time Use dataset#
Dataset: Statistics Canada General Social Survey’s (GSS) Time Use (TU) Survey
Tracks how people spend their time
two parts:
an episode file where each row describes an event for one person; each person has one row per event (like “make coffee”) that they experienced.
a main file that includes meta-information about the individuals and also includes summary information from the episode file; there is 1 row of information per person.
we will stick to the “main” file for now
The data are stored in file gss_tu2016_main_file.csv. The name uses abbreviations:
GSS: general social surveytu2016: time use from the year 2016csv: comma-separated values
Import Time Use Survey Data using pandas#
import pandas as pd

timeuse_filename = "gss_tu2016_main_file.csv"

time_use_data = pd.read_csv(timeuse_filename)

time_use_data.head()
| CASEID | pumfid | wght_per | survmnth | wtbs_001 | agecxryg | agegr10 | agehsdyc | ageprgrd | chh0014c | ... | ree_02 | ree_03 | rlr_110 | lan_01 | lanhome | lanhmult | lanmt | lanmtmul | incg1 | hhincg1 | |
|---|---|---|---|---|---|---|---|---|---|---|---|---|---|---|---|---|---|---|---|---|---|
| 0 | 10000 | 10000 | 616.6740 | 7 | 305.1159 | 96 | 5 | 62 | 96 | 0 | ... | 1 | 1 | 1 | 1 | 1 | 1 | 1 | 1 | 1 | 1 |
| 1 | 10001 | 10001 | 8516.6140 | 7 | 0.0000 | 6 | 5 | 32 | 5 | 0 | ... | 5 | 6 | 3 | 1 | 5 | 2 | 5 | 2 | 5 | 8 |
| 2 | 10002 | 10002 | 371.7520 | 1 | 362.7057 | 2 | 4 | 9 | 10 | 3 | ... | 5 | 1 | 1 | 1 | 1 | 1 | 1 | 1 | 3 | 8 |
| 3 | 10003 | 10003 | 1019.3135 | 3 | 0.0000 | 96 | 6 | 65 | 96 | 0 | ... | 3 | 2 | 2 | 1 | 1 | 1 | 1 | 1 | 2 | 2 |
| 4 | 10004 | 10004 | 1916.0708 | 9 | 11388.9706 | 96 | 2 | 25 | 96 | 0 | ... | 9 | 99 | 9 | 9 | 99 | 9 | 99 | 9 | 2 | 4 |
5 rows × 350 columns
# size of your table
time_use_data.shape
(17390, 350)
There are 17 390 rows and 350 columns in
time_use_data.DataFrame.shapereturns a tuple (a Python data type that stores multiple values).Items in a tuple can be accessed in a similar way to a list.
# number of rows
time_use_data.shape[0]
17390
# number of columns
time_use_data.shape[1]
350
Question#
Do urban residents with more children report feeling more rushed than those with fewer children?
Let’s narrow the question even further …
Do urban residents with one or more children report feeling more rushed every day versus never feeling rushed than those with no children?
Among urban respondents that feel rushed daily or never feel rushed our data analysis will consist of computing the two proportions:
Wrangle the Time Use Survey Data#
Create a new DataFrame with only the relevant columns needed for the data analysis. In other words, create a subset of time_use_data.
Selecting columns from a DataFrame#
What columns are relevant?
To create an easy to use data set we will only keep the following columns:
CASEID: participant IDluc_rst: large urban centre vs rural and small townschh0014c: number of kids 14 or undergtu_110: feeling rushed
You can see the full codebook here.
important_columns = ["CASEID","luc_rst","chh0014c","gtu_110"]

subset_time_use_data = time_use_data[important_columns]
subset_time_use_data.head()
| CASEID | luc_rst | chh0014c | gtu_110 | |
|---|---|---|---|---|
| 0 | 10000 | 1 | 0 | 1 |
| 1 | 10001 | 1 | 0 | 3 |
| 2 | 10002 | 1 | 3 | 1 |
| 3 | 10003 | 1 | 0 | 2 |
| 4 | 10004 | 1 | 0 | 1 |
Rename columns#
Use the rename function to rename columns.
columnnames = {"CASEID": "Participant ID",
               "luc_rst": "Urban/Rural",
               "chh0014c": "Kids under 14",
               "gtu_110": "Feeling Rushed"}

subset_time_use_data_colnames = subset_time_use_data.rename(columns=columnnames)

list(subset_time_use_data_colnames)
['Participant ID', 'Urban/Rural', 'Kids under 14', 'Feeling Rushed']
From the codebook
 luc_rst            Population centre indicator

           VALUE  LABEL
               1  Larger urban population centres (CMA/CA)
               2  Rural areas and small population centres (non CMA/CA)
               3  Prince Edward Island
               6  Valid skip
               7  Don't know
               8  Refusal
               9  Not stated

           Data type: numeric
           Missing-data codes: 6-9
           Record/column: 1/59
 chh0014c           Child(ren) in household - 0 to 14 years

           VALUE  LABEL
               0  None
               1  One
               2  Two
               3  Three or more
               6  Valid skip
               7  Don't know
               8  Refusal
               9  Not stated

           Data type: numeric
           Missing-data codes: 6-9
           Record/column: 1/40
      gtu_110            General time use - Feel rushed

           VALUE  LABEL
               1  Every day
               2  A few times a week
               3  About once a week
               4  About once a month
               5  Less than once a month
               6  Never
              96  Valid skip
              97  Don't know
              98  Refusal
              99  Not stated

           Data type: numeric
           Missing-data codes: 96-99
           Record/columns: 1/60-61
Select respondents that live in urban areas#
Select the Urban/Rural column.
 luc_rst            Population centre indicator

           VALUE  LABEL
               1  Larger urban population centres (CMA/CA)
               2  Rural areas and small population centres (non CMA/CA)
               3  Prince Edward Island
               6  Valid skip
               7  Don't know
               8  Refusal
               9  Not stated

           Data type: numeric
           Missing-data codes: 6-9
           Record/column: 1/59
urbanrural_col = subset_time_use_data_colnames["Urban/Rural"]
Create a Boolean variable that is
Trueif respondent lives in urban area andFalseotherwise.
urban = urbanrural_col == 1 # crate the Boolean variable
Look at the head (first 5 rows) of the Series using .head()
urban.head()
0    True
1    True
2    True
3    True
4    True
Name: Urban/Rural, dtype: bool
We can combine
urbanrural_col = subset_time_use_data_colnames["Urban/Rural"]

urban = urbanrural_col == 1
into one line of code
urban = (subset_time_use_data_colnames["Urban/Rural"] == 1)
urban.sum() # add up the total number of `True` values
13319
Select all the participants (rows) who live in urban areas in subset_time_use_data_colnames using the Boolean series urban.
subset_time_use_data_colnames[urban].head()
| Participant ID | Urban/Rural | Kids under 14 | Feeling Rushed | |
|---|---|---|---|---|
| 0 | 10000 | 1 | 0 | 1 |
| 1 | 10001 | 1 | 0 | 3 |
| 2 | 10002 | 1 | 3 | 1 |
| 3 | 10003 | 1 | 0 | 2 |
| 4 | 10004 | 1 | 0 | 1 |
subset_time_use_data_colnames.shape
(17390, 4)
There are 17 390 rows and 4 columns in
subset_time_use_data_colnames.
Define a DataFrame with only urban respondents and relevant columns#
urban_df = subset_time_use_data_colnames[urban]

urban_df.shape # we are left with 13 319 when we extract participants from "urban" areas only
(13319, 4)
Examine the distributions of each column using value_counts()#
Distribution of Kids under 14.
urban_df["Kids under 14"].value_counts()
Kids under 14
0    10514
1     1268
2     1168
3      369
Name: count, dtype: int64
 chh0014c           Child(ren) in household - 0 to 14 years

           VALUE  LABEL
               0  None
               1  One
               2  Two
               3  Three or more
               6  Valid skip
               7  Don't know
               8  Refusal
               9  Not stated

           Data type: numeric
           Missing-data codes: 6-9
           Record/column: 1/40
Distribution of Feeling Rushed.
urban_df["Feeling Rushed"].value_counts()
Feeling Rushed
1     3986
2     3888
3     1994
6     1802
4     1037
5      562
97      49
98       1
Name: count, dtype: int64
      gtu_110            General time use - Feel rushed

           VALUE  LABEL
               1  Every day
               2  A few times a week
               3  About once a week
               4  About once a month
               5  Less than once a month
               6  Never
              96  Valid skip
              97  Don't know
              98  Refusal
              99  Not stated

           Data type: numeric
           Missing-data codes: 96-99
           Record/columns: 1/60-61
Distribution of Urban/Rural.
urban_df["Urban/Rural"].value_counts()
Urban/Rural
1    13319
Name: count, dtype: int64
Let’s compute
to answer
Do urban residents with one or more children report feeling more rushed every day versus never feeling rushed than those with no children?
Let’s start with the denominator of \(\text{Proportion}_\text{at least one kid}\):
\({\text{Number of respondents with at least one kid that never feel rushed or feel rushed daily}}\)
Define a Boolean variable kids_norush that is:
Trueif:a respondent has at least one kid (
urban_df["Kids under 14"] >= 1) andnever feels rushed (
urban_df["Feeling Rushed"] == 6)
Falseotherwise.
kids_norush = (urban_df["Kids under 14"] >= 1) & (urban_df["Feeling Rushed"] == 6)
Define a Boolean variable kids_rush that is:
Trueif:a respondent has at least one kid (
urban_df["Kids under 14"] >= 1) andnever feels rushed (
urban_df["Feeling Rushed"] == 1)
Falseotherwise.
kids_rush = ((urban_df["Kids under 14"] >= 1) & (urban_df["Feeling Rushed"] == 1))
Compute the total number respondents with urban_df[Kids under 14] >= 1 that feel rushed daily or never feel rushed.
Total_kids_norush = kids_norush.sum()

Total_kids_rush = kids_rush.sum()

Total_kids_norush + Total_kids_rush
1485
Now compute the proportion that feel rushed among those with at least one kid.
prop_kids = Total_kids_rush / (Total_kids_norush + Total_kids_rush)

prop_kids
0.94006734006734
Let’s do the same for respondents with no kids.
nokids_norush = ((urban_df["Kids under 14"] == 0) & (urban_df["Feeling Rushed"] == 6))

nokids_rush = ((urban_df["Kids under 14"] == 0) & (urban_df["Feeling Rushed"] == 1))

Total_nokids_norush = nokids_norush.sum()

Total_nokids_rush = nokids_rush.sum()

prop_nokids = Total_nokids_rush/(Total_nokids_norush + Total_nokids_rush)

prop_nokids
0.6019056472228678
Let’s multiply by 100 and round to decimal places to express as a percentage and print out an informative description of the statistic.
percent_kids = round(prop_kids * 100, 2)

percent_nokids = round(prop_nokids * 100, 2)

print(percent_kids)

print(percent_nokids)
94.01
60.19
Let’s add a more detailed description.
nokidstext = "The percentage of respondents with kids that feel rushed is"

print(f"{nokidstext} {percent_kids}%.") # print interpretation of percent with kids

print("\n") # add a blank line

kidstext = "The percentage of respondents with no kids that feel rushed is"

print(f"{kidstext} {percent_nokids}%.") # print interpretation of percent with no kids

print("\n")  # add a blank line

difftext = "more respondents with kids feel rushed compared to respondents without kids."

print(f"{round(percent_kids - percent_nokids, 2)}% {difftext}")
The percentage of respondents with kids that feel rushed is 94.01%.


The percentage of respondents with no kids that feel rushed is 60.19%.


33.82% more respondents with kids feel rushed compared to respondents without kids.
Did we answer the question?#
Do urban residents with more children report feeling more rushed than those with fewer children?
print(f"{nokidstext} {percent_kids}%.") # print interpretation of percent with kids
print("\n") # add a blank line
print(f"{kidstext} {percent_nokids}%.") # print interpretation of percent with no kids
print("\n")  # add a blank line
print(f"{round(percent_kids - percent_nokids, 2)}% {difftext}")
The percentage of respondents with kids that feel rushed is 94.01%.


The percentage of respondents with no kids that feel rushed is 60.19%.


33.82% more respondents with kids feel rushed compared to respondents without kids.
# feel free to further experiment with the DataFrame