Welcome to GGR274#
What is Data Science?
What is the role of Statistics in Data Science?
Where is Data Science Used in Society?#
Questions#
Is there a Bike Share bike available?
Will I experience another TTC delay today?
Will this person commit a crime in the future?
Does COVID-19 affect males more than females?
What movies might this person enjoy?
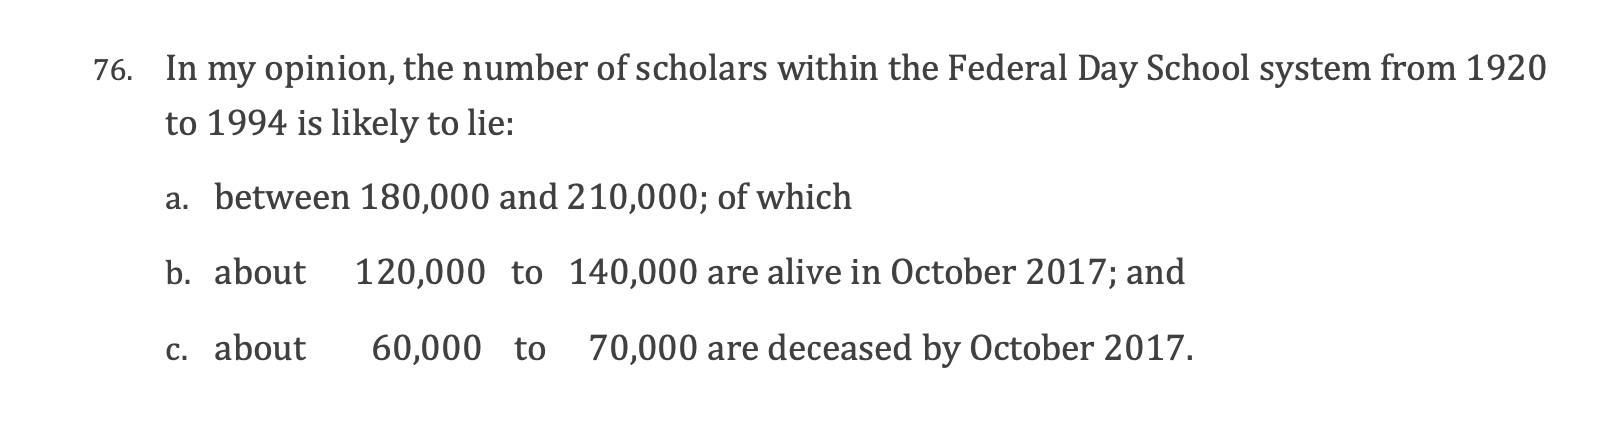
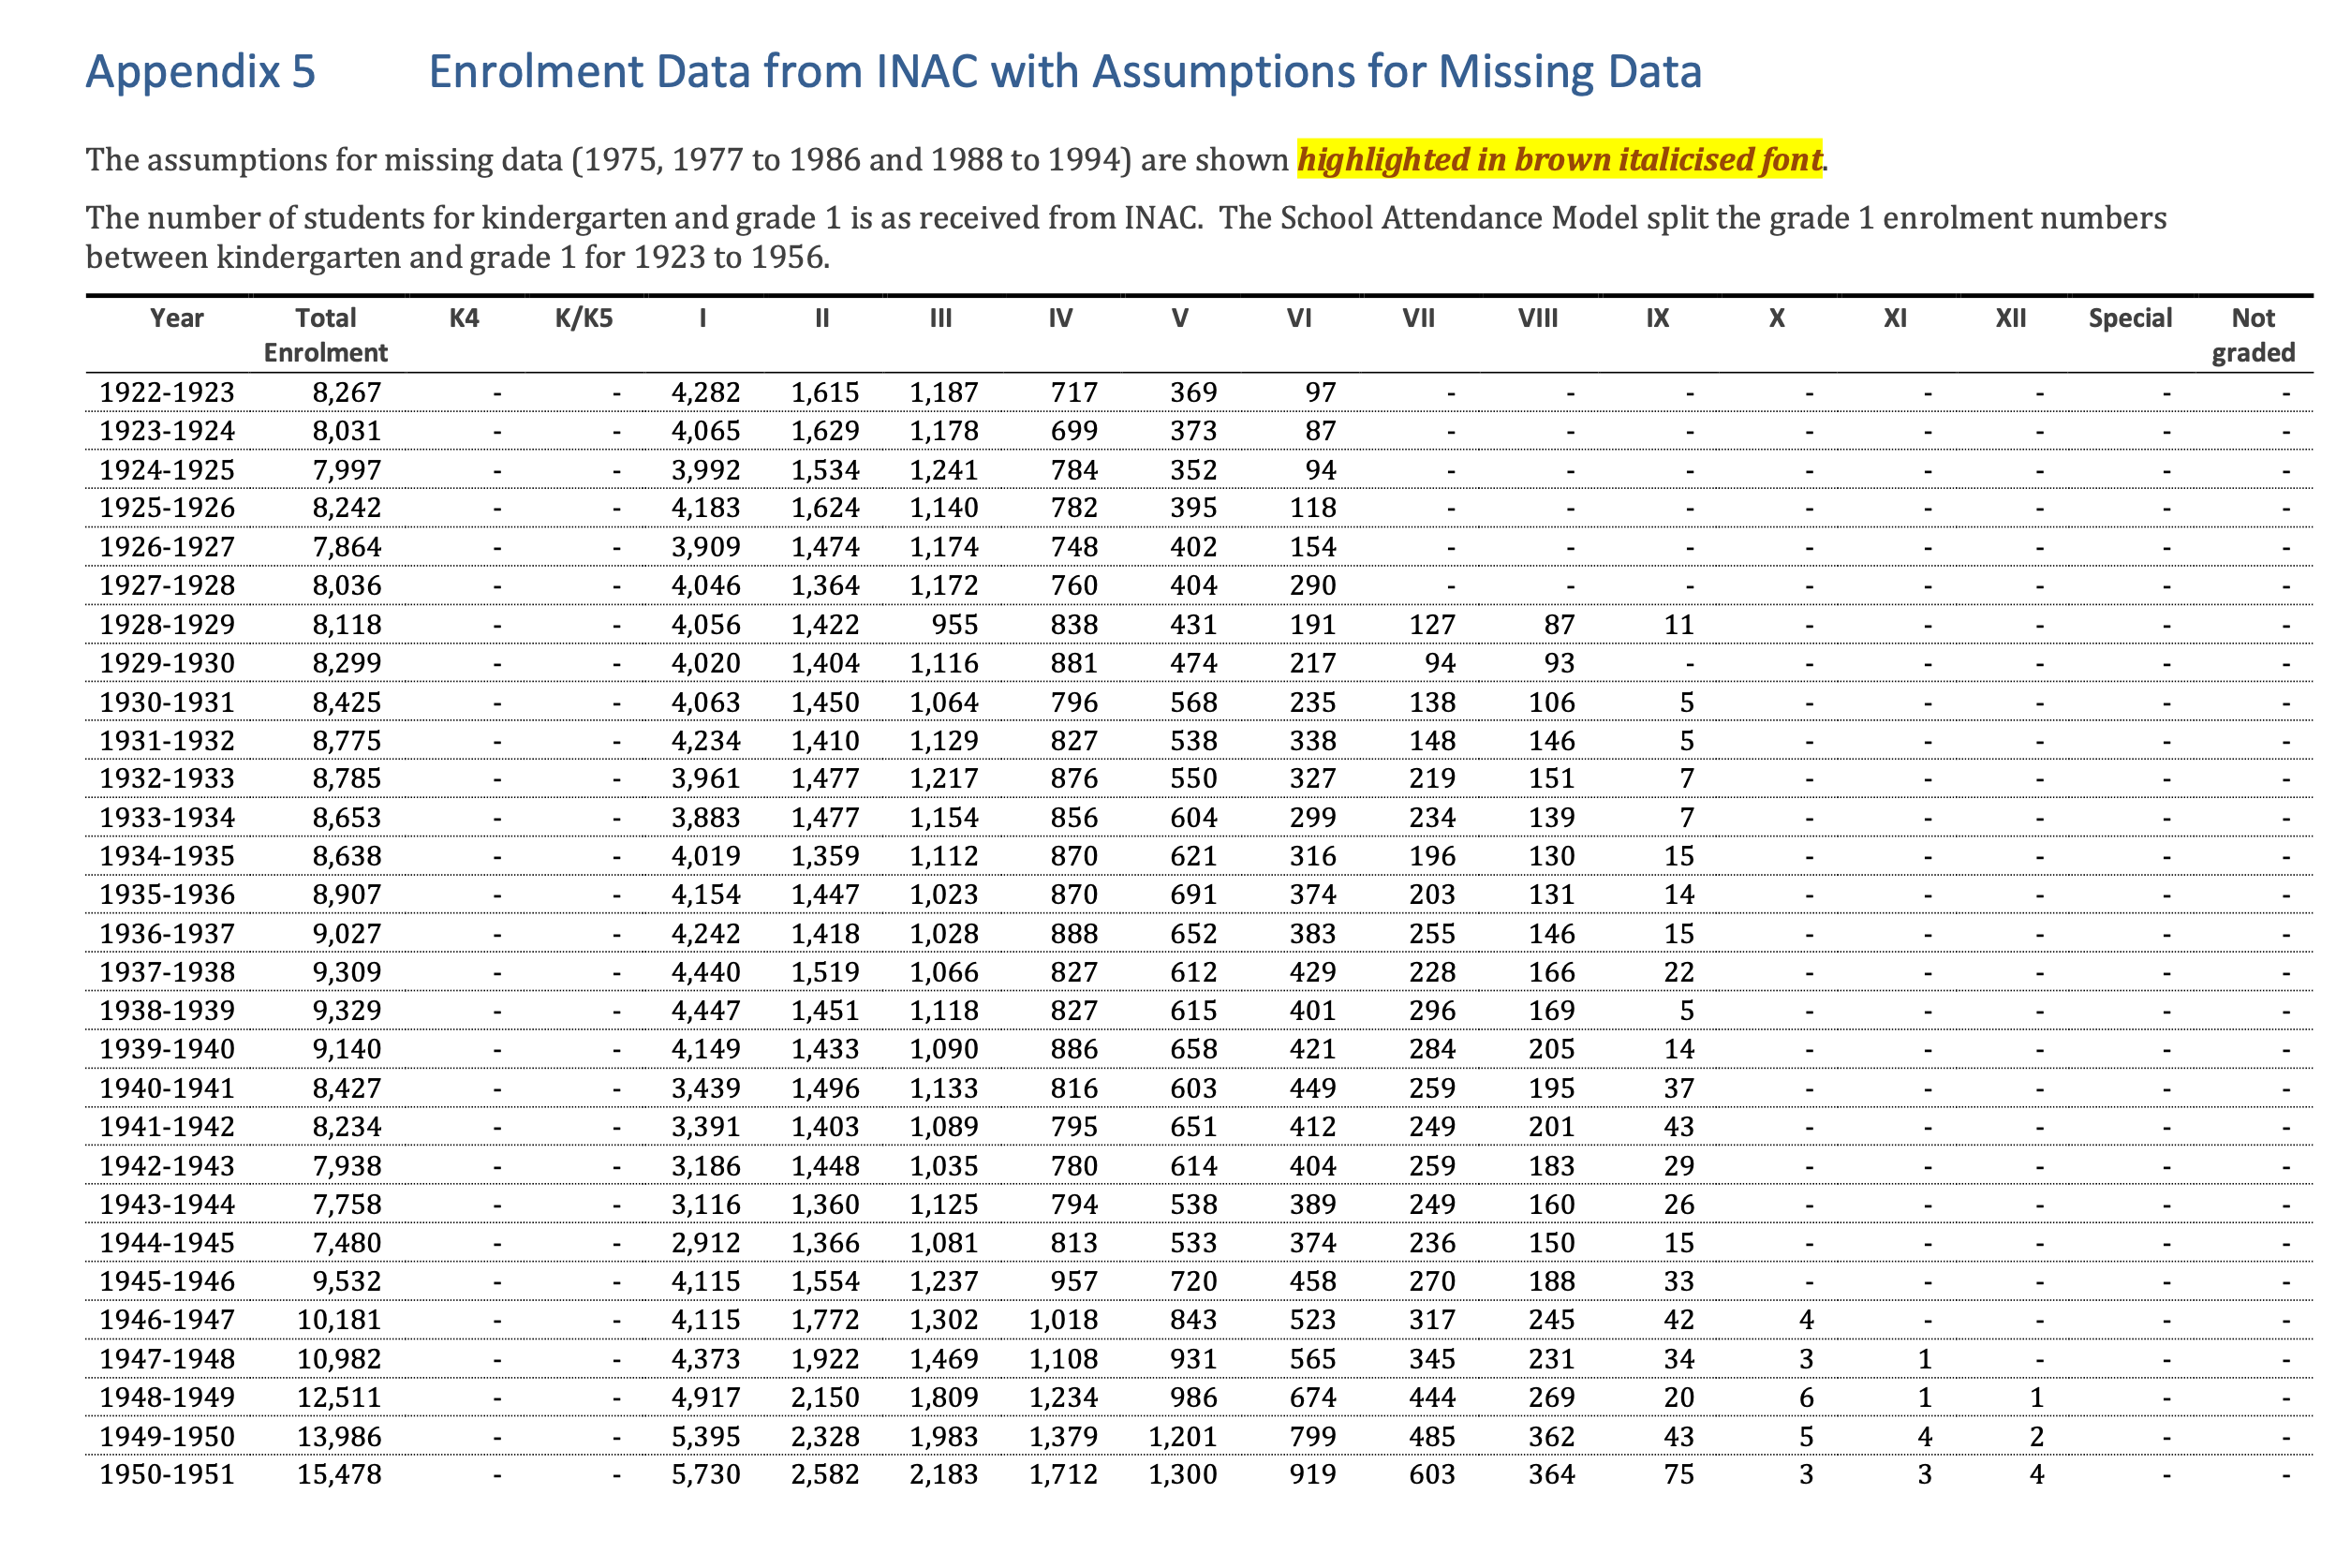
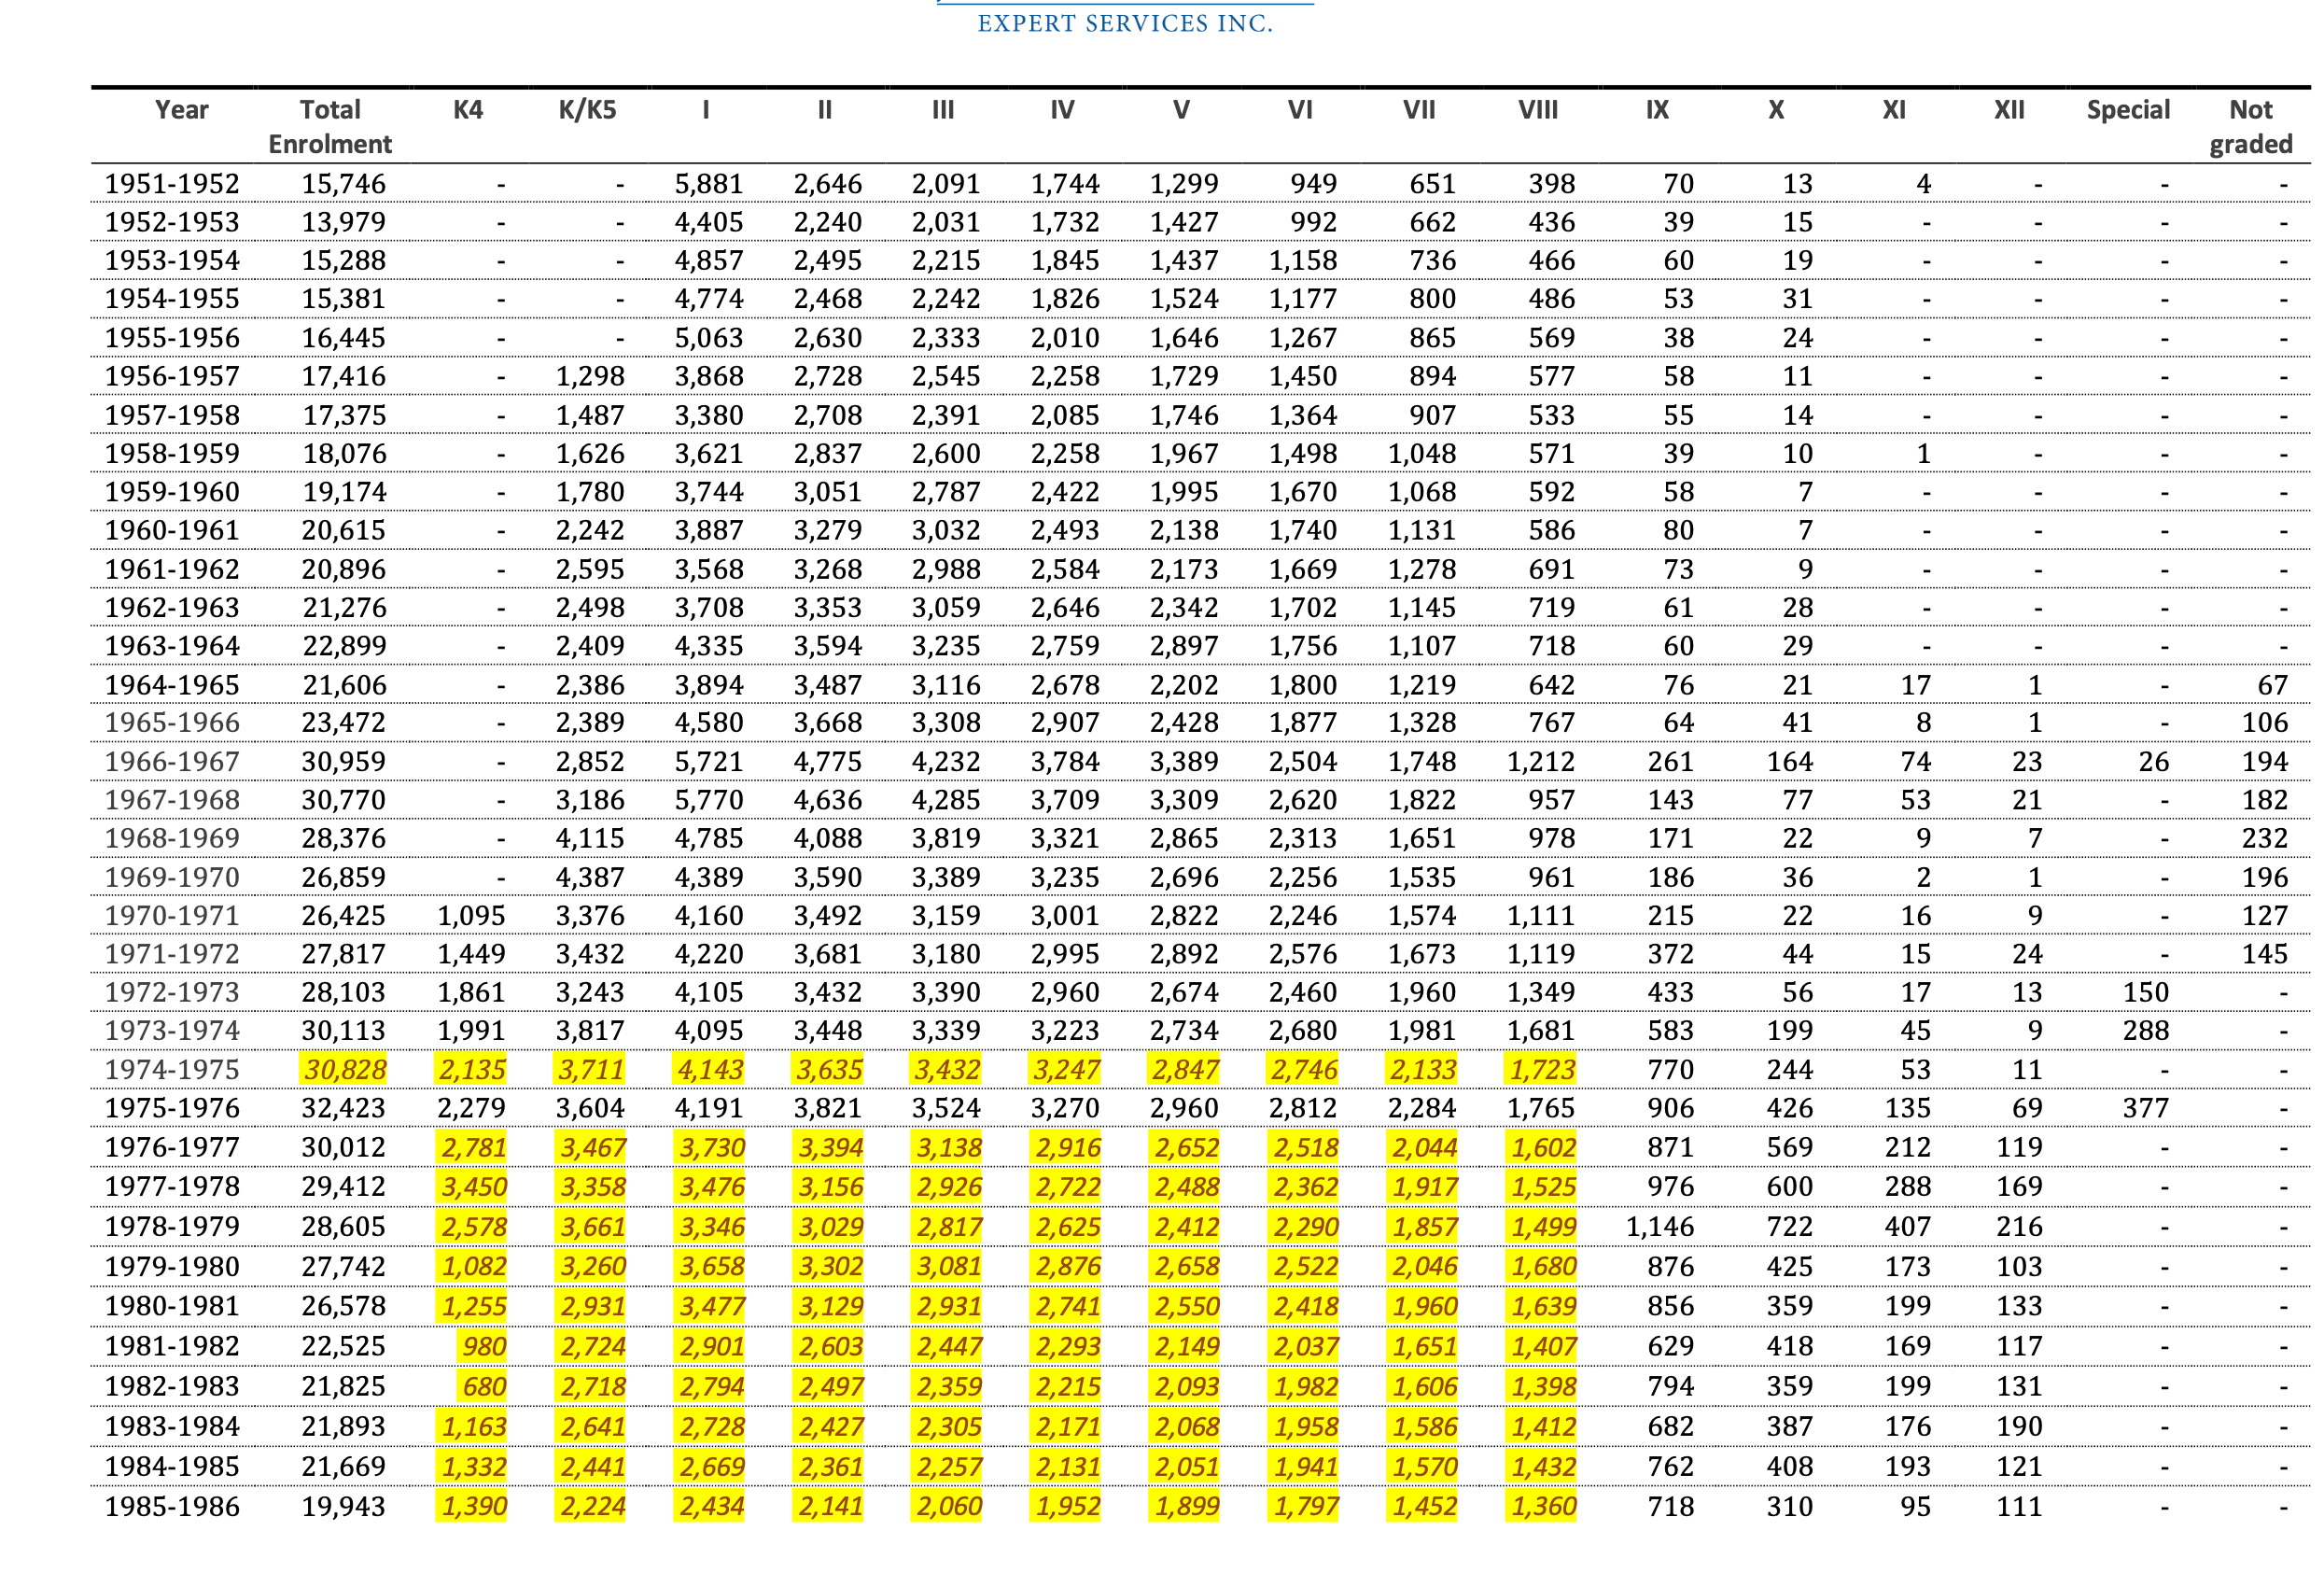
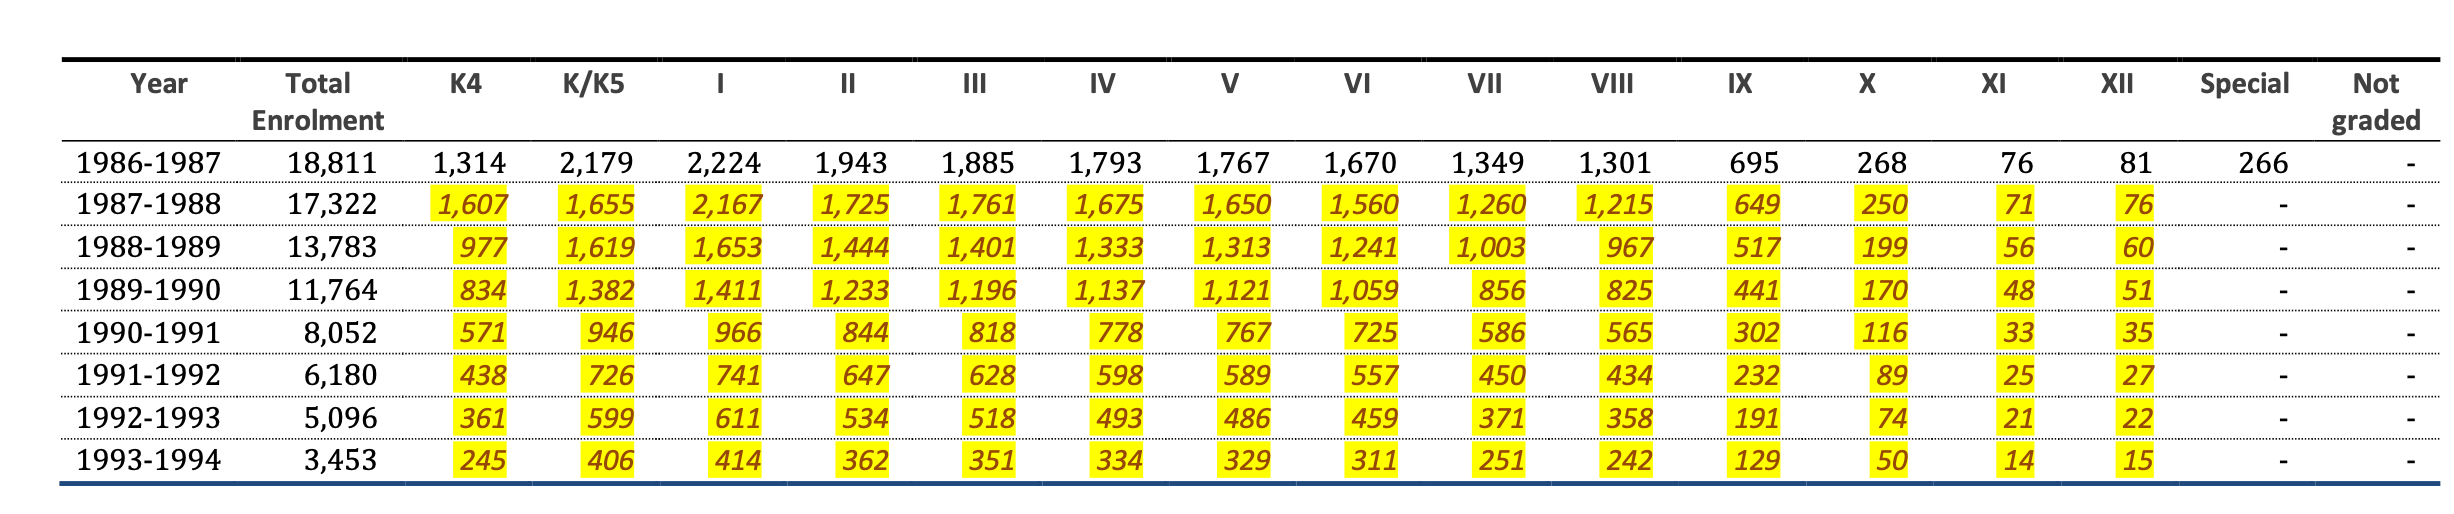
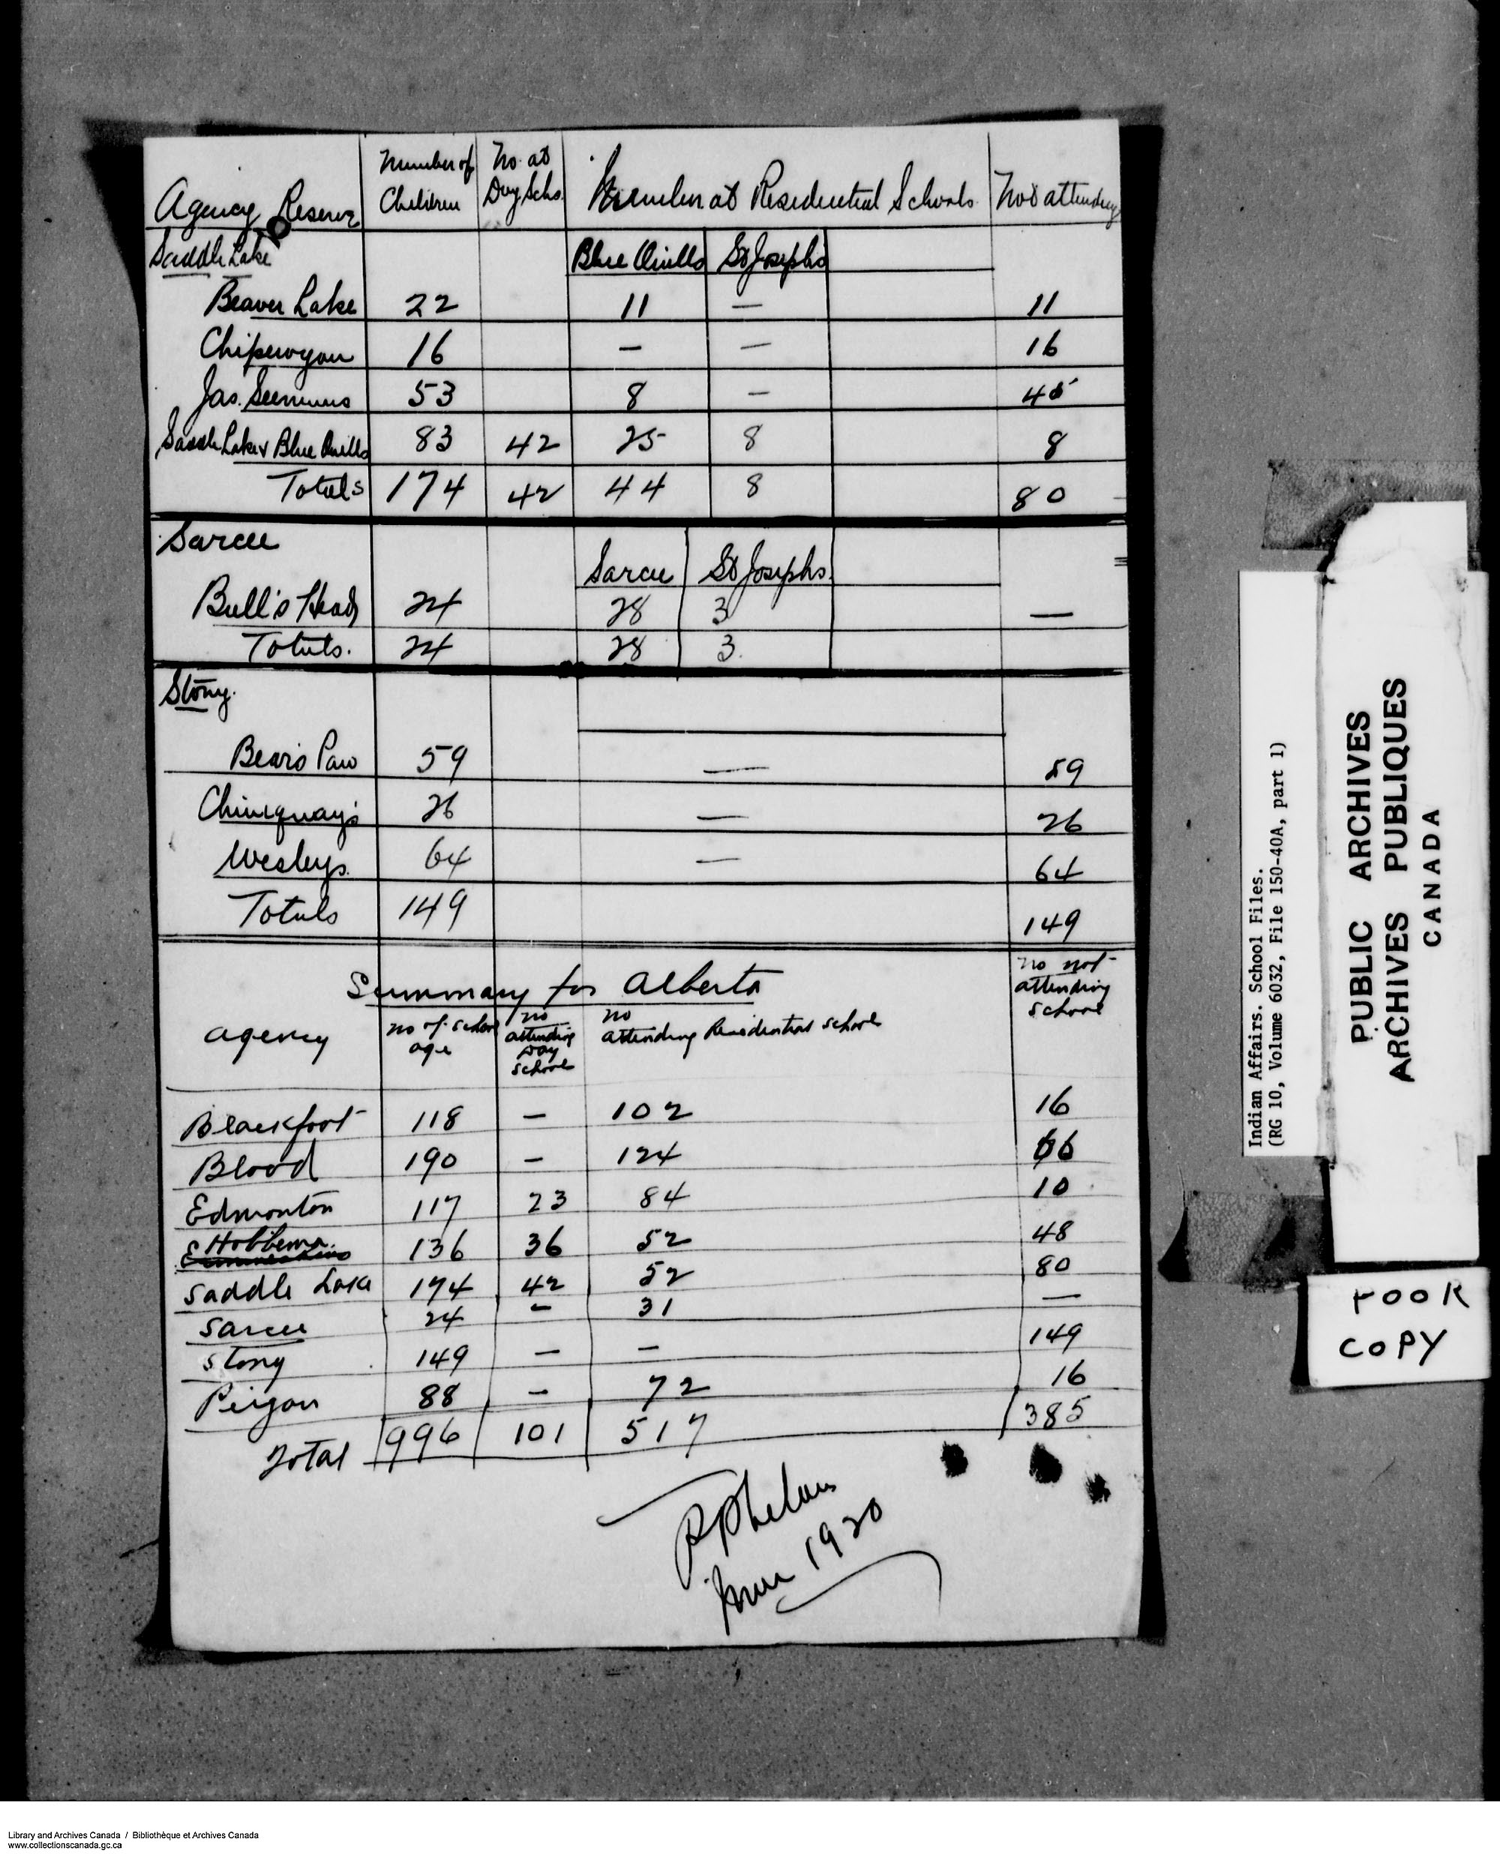
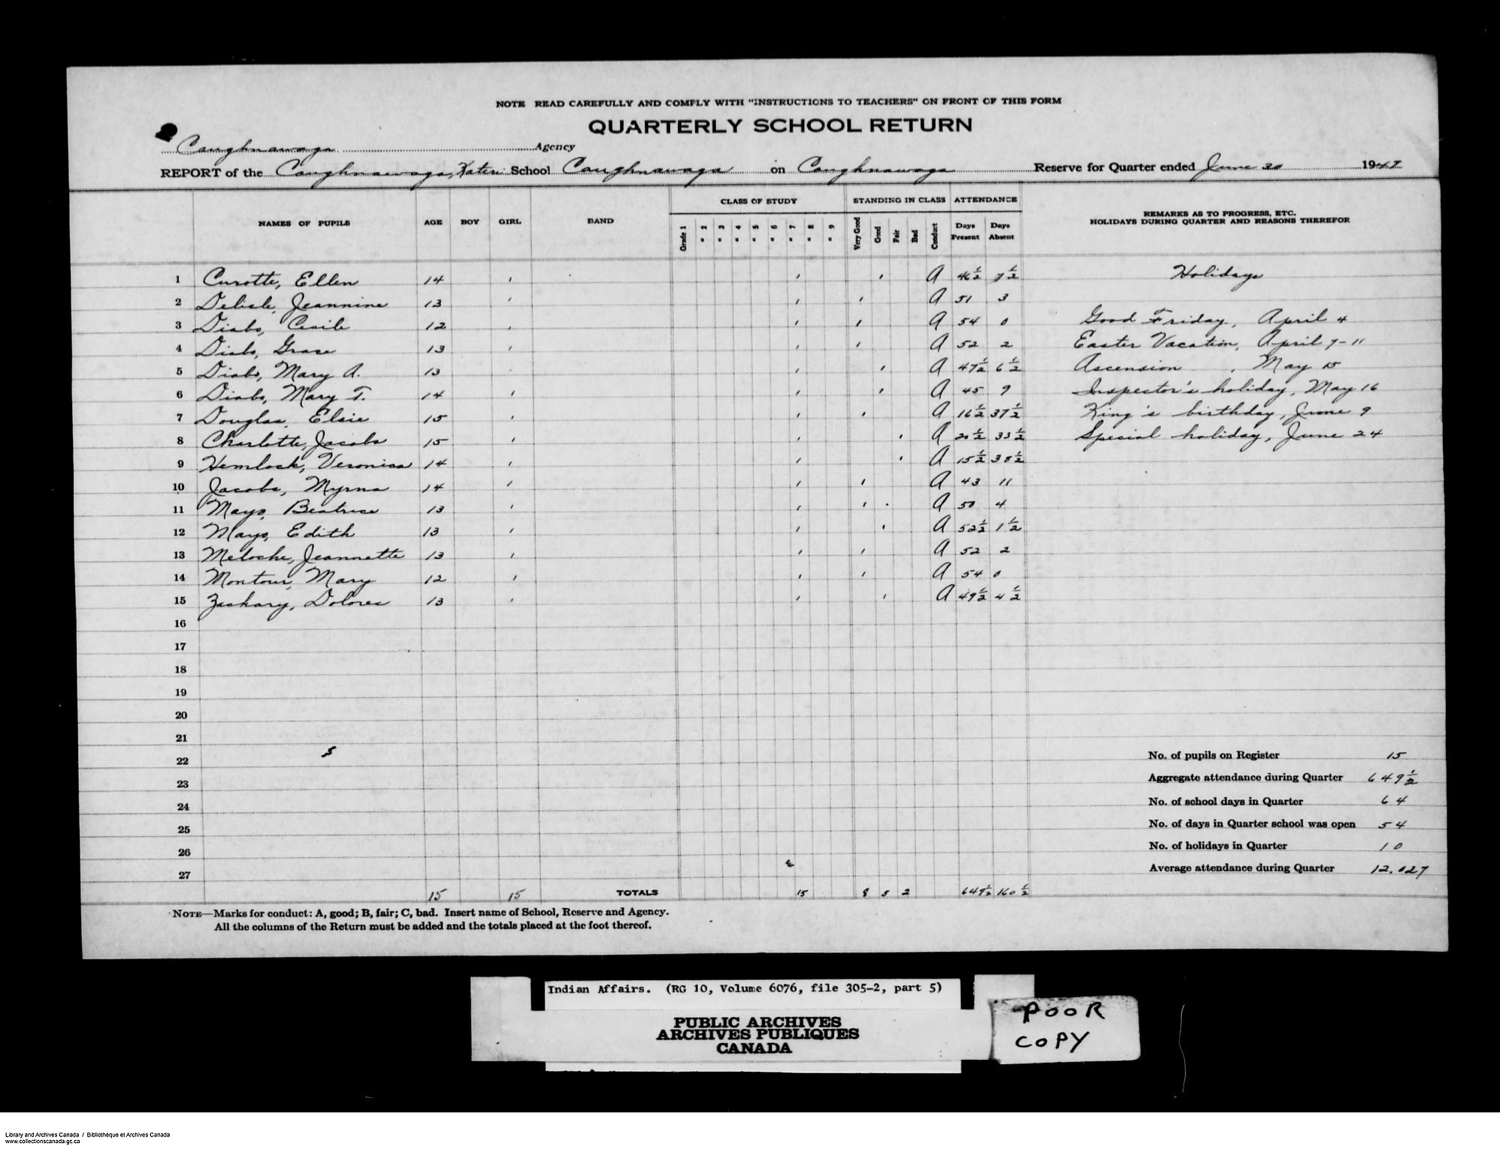
How many people attended Indian Day Schools in Canada?
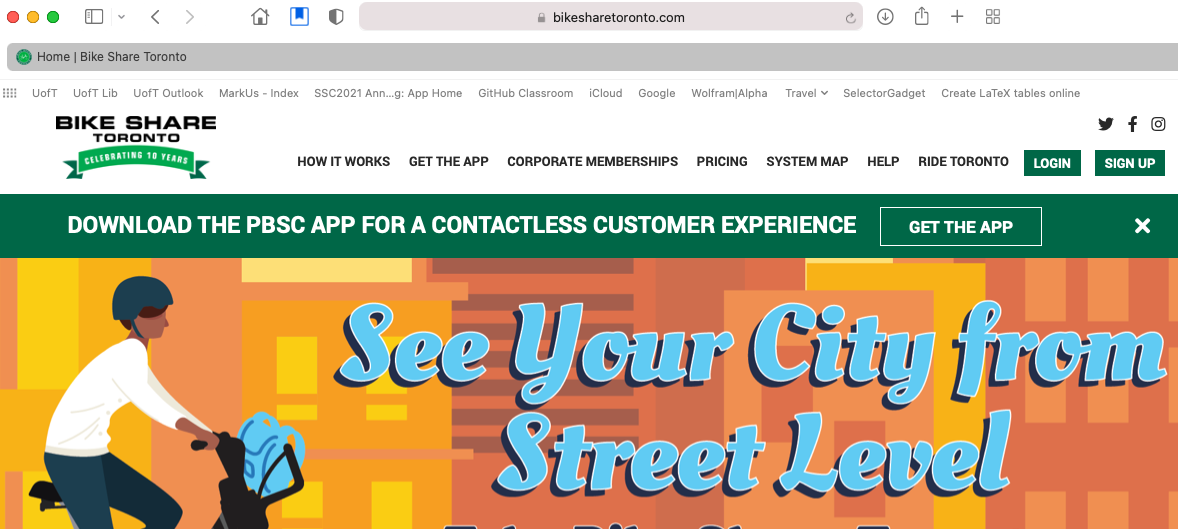
Bike Share Toronto#
Is there a bike available at St. George St. /Hoskin Ave.?
Visualization using maps#
Don’t worry about understanding the code today - it’s complicated, but we will be learning as the course goes on
import folium

m = folium.Map(location=[43.664288100559816, -79.39800603825044], zoom_start =18)
m
Step 1#
Read the data from https://tor.publicbikesystem.net/ube/gbfs/v1/en/station_information into Python.
{"last_updated":1637611674,"ttl":30,"data":{"stations":[{"station_id":"7000","name":"Fort York Blvd / Capreol Ct","physical_configuration":"REGULAR","lat":43.639832,"lon":-79.395954,"altitude":0.0,"address":"Fort York Blvd / Capreol Ct","capacity":35,"rental_methods":["KEY","TRANSITCARD","CREDITCARD","PHONE"],"groups":[],"obcn":"647-643-9607","nearby_distance":500.0},{"station_id":"7001","name":"Wellesley Station Green P","physical_configuration":"REGULAR","lat":43.66496415990742,"lon":-79.38355031526893,"altitude":0.0,"address":"Yonge / Wellesley","post_code":"M4Y 1G7","capacity":17,"rental_methods":["KEY","TRANSITCARD","CREDITCARD","PHONE"],"groups":[],"obcn":"416-617-9576","nearby_distance":500.0},
🙀 Don’t worry about understanding all the details for now …
import pandas as pd

station_url = 'https://tor.publicbikesystem.net/ube/gbfs/v1/en/station_information'
stationinfo = pd.read_json(station_url)

stationlist = stationinfo['data'].iloc[0]
The first station data looks a bit better:
stationlist[0]
Step 2#
A bit of programming is needed to transform the data into a format that can be displayed on the map above.
# convert JSON format to GeoJSON format
def featuredict(lon,lat, id1, name, capacity):
    dict = {
        "type": "Feature",
        "geometry": {
            "type": "Point",
            "coordinates":  [lon,lat]
        },
        "properties": {
            "station_id": id1,
            "name": name,
            "capacity": capacity
        }
    }
    return(dict)


# featuredict1 = create_station_list
def create_station_list(l):
    m = []
    for x in range(0,len(l)):
        m.append(
            featuredict(
                l[x]['lon'],
                l[x]['lat'],
                l[x]['station_id'],
                l[x]['name'],
                l[x]['capacity']
            )
        )
        x += 1
    return(m)

stations = create_station_list(stationlist)
stations[0:2]
Step 2 (Cont’d)#
More data transformation …
# convert stations list to GeoJSON format

def add_GeoJSON_formatting(features):
    dict = {
        "type": "FeatureCollection",
        "features": features
    }
    return(dict)


stations_geoj = add_GeoJSON_formatting(stations)
stations_geoj['features'][0]
A Data Science Application#
Question: How many bikes are available
Data: TO Bike Share data
Communicate the results: Visualize the data on a map where the bikes are located
Next Steps: Predict how many bikes are available at hourly intervals
folium.GeoJson(
    stations_geoj,
    name = "Bikes",
    tooltip = folium.features.GeoJsonTooltip(fields=['station_id','name','capacity'], localize=True)
).add_to(m)
m
TTC Subway Delays#
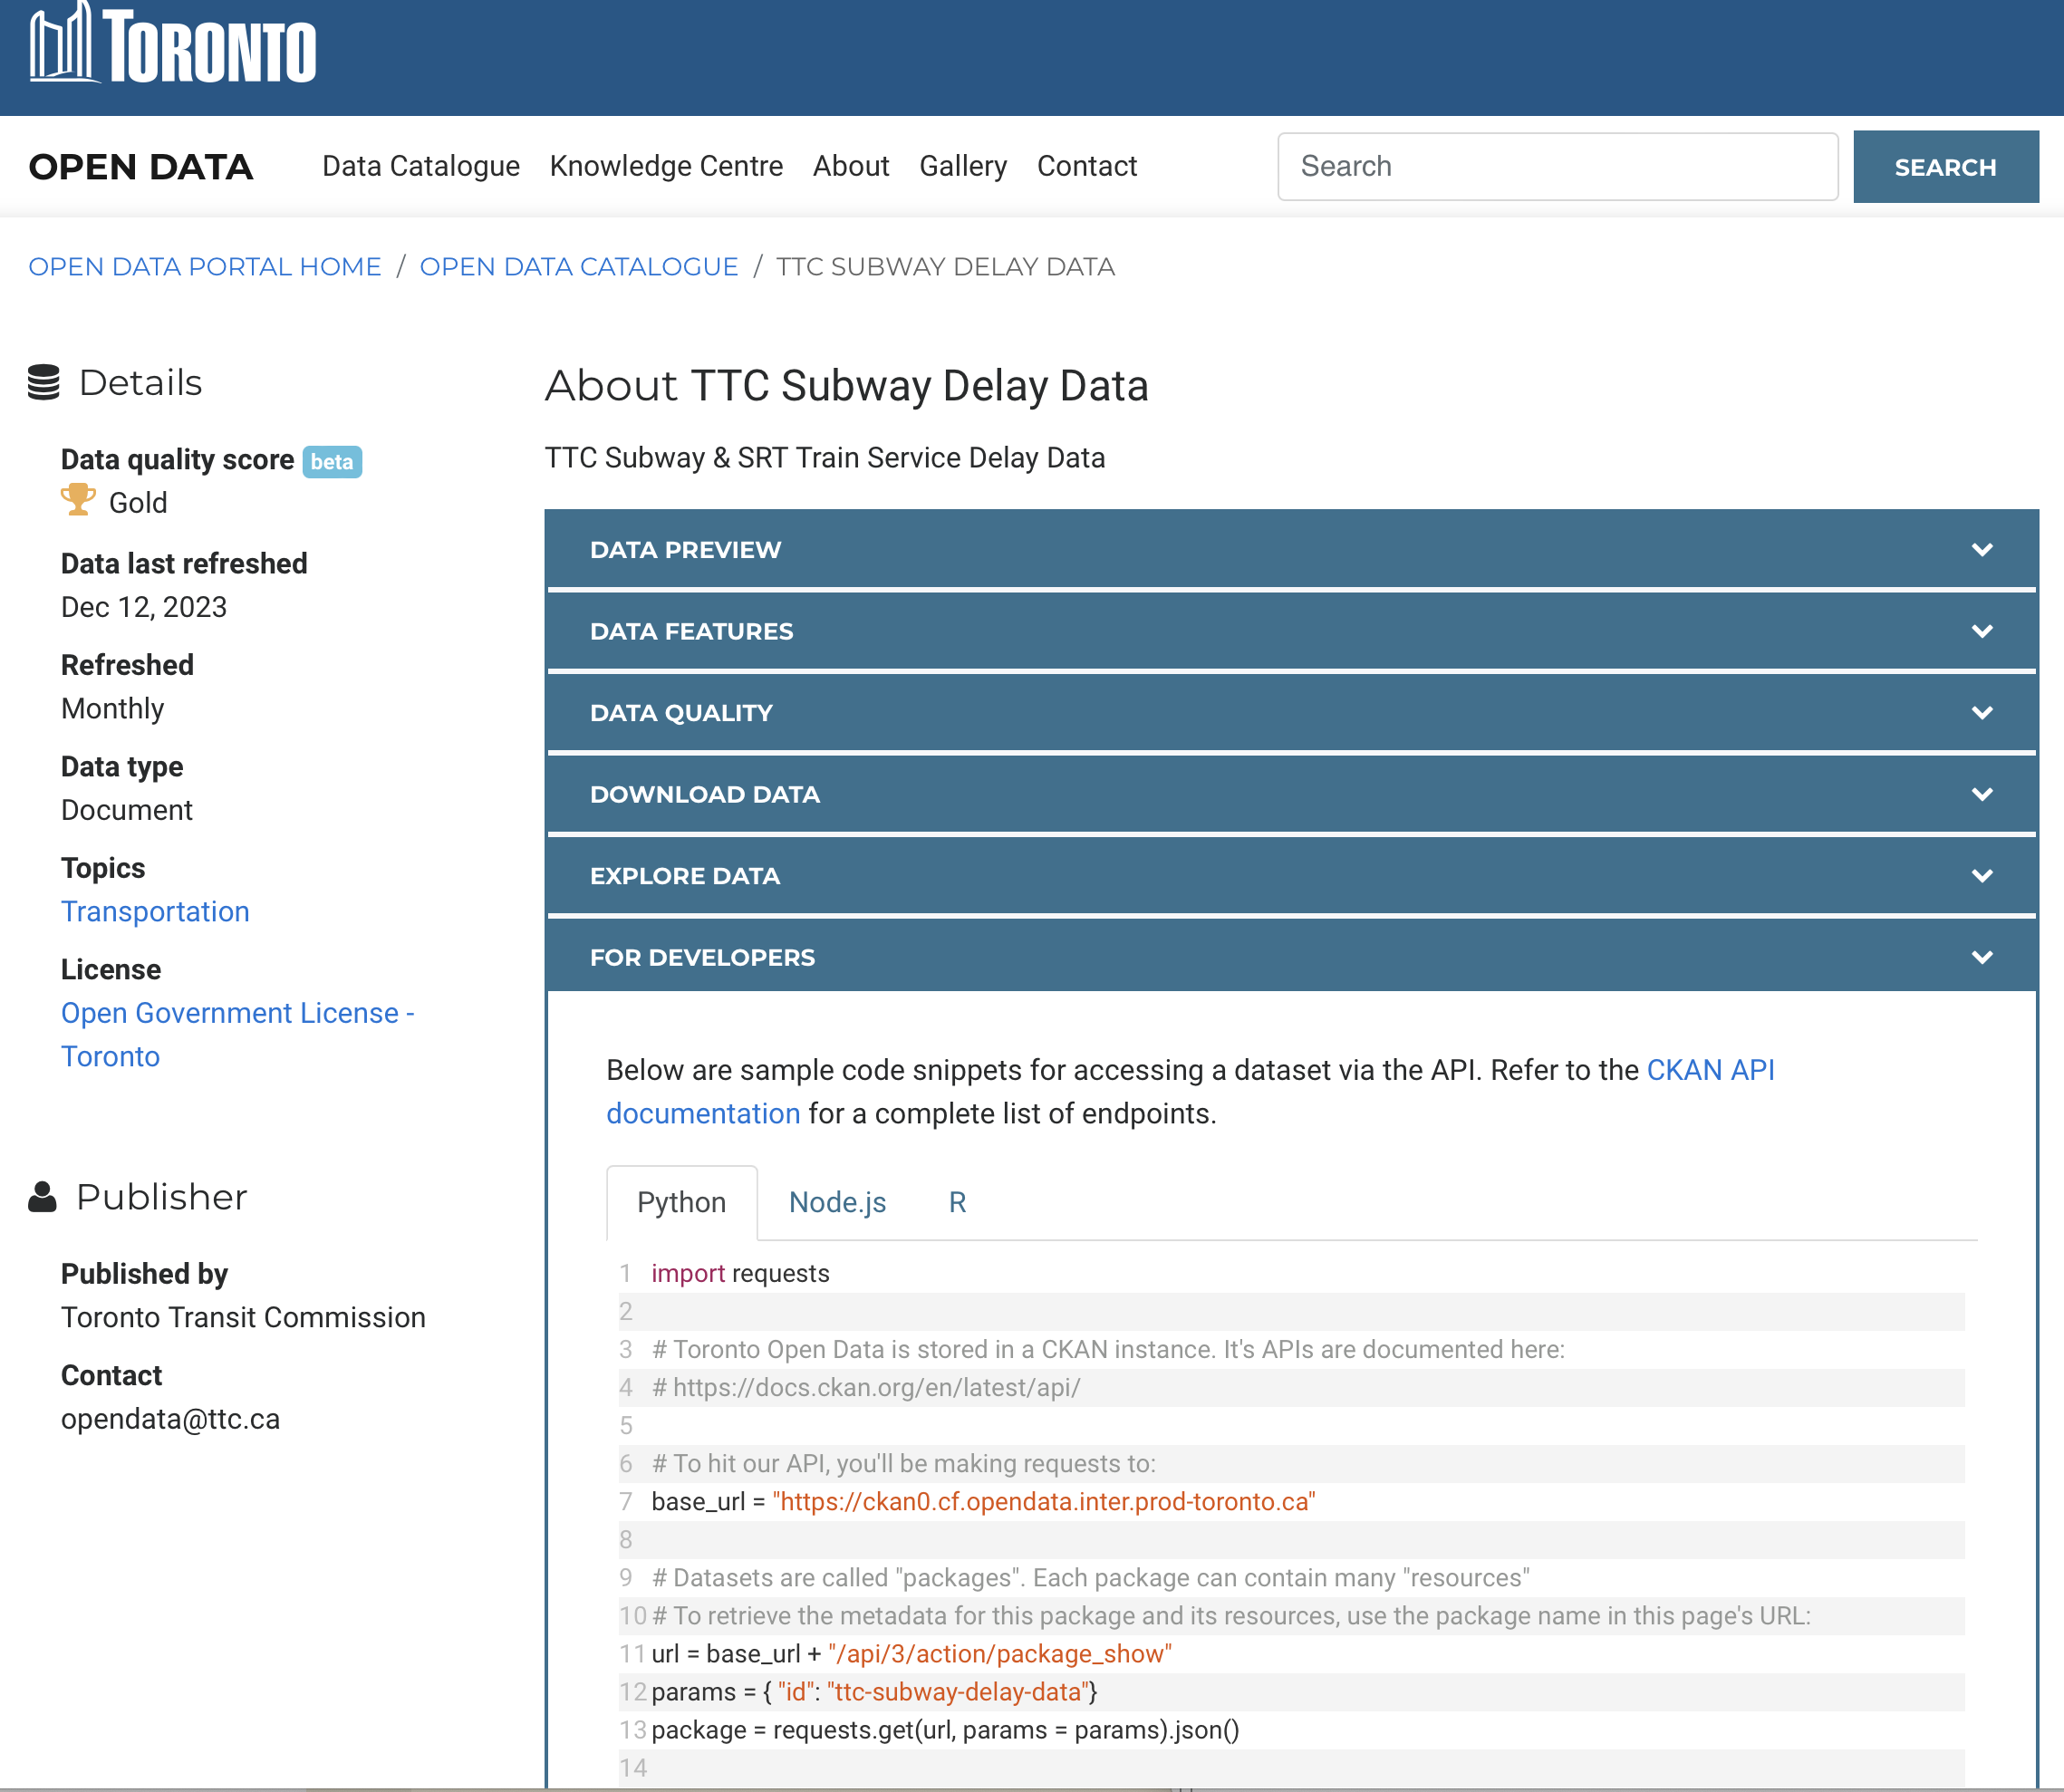
Steps to Read the Public Data#
Extract data file locations.
import requests
# Toronto Open Data is stored in a CKAN instance. It's APIs are documented here:
# https://docs.ckan.org/en/latest/api/

# To hit our API, you'll be making requests to:
base_url = "https://ckan0.cf.opendata.inter.prod-toronto.ca"

# Datasets are called "packages". Each package can contain many "resources"
# To retrieve the metadata for this package and its resources, use the package name in this page's URL:
url = base_url + "/api/3/action/package_show"
params = { "id": "ttc-subway-delay-data"}
package = requests.get(url, params = params).json()
xlsx_list = []

# To get resource data:
for idx, resource in enumerate(package["result"]["resources"]):

       # To get metadata for non datastore_active resources:
       if not resource["datastore_active"]:
           url = base_url + "/api/3/action/resource_show?id=" + resource["id"]
           resource_metadata = requests.get(url).json()['result']
           # From here, you can use the "url" attribute to download this file
           print(resource_metadata['url'])
           xlsx_list.append(resource_metadata['url'])
Read the files of interest, say files for 2022 and 2023.
import re
import pandas as pd
p = re.compile(".+(2022|2023)")
df_list = []

for x in xlsx_list:
    if p.match(x):
        print(x)
        df_list.append(pd.read_excel(x))

ttc_delays = pd.concat(df_list)
ttc_delays
What can we learn from the data?#
Plotting (with a bit of manipulation) usually helps us see patterns that we might not see otherwise.
import seaborn as sns
ttc_delays_stn = ttc_delays.groupby(
    "Station" # station names need cleaning...
).agg(
    {"Min Delay": "sum"}
).reset_index().sort_values(
    "Min Delay", ascending = False
).head(15)
# print(ttc_delays_stn)
g = sns.barplot(
    data = ttc_delays_stn,
    x = "Min Delay",
    y = "Station"
)
g.set(xlabel = "Total Length of Delays (min)", ylabel = "Top 15 Stations")
ttc_delays["Year"] = ttc_delays["Date"].apply(lambda x: x.year)
ttc_delays["Month"] = ttc_delays["Date"].apply(lambda x: x.month)
ttc_delays_ymd = ttc_delays.groupby(
    ["Year", "Month"]
).size().reset_index(name = "Number of Delays")

g = sns.lineplot(
    data = ttc_delays_ymd,
    x = "Month",
    y = "Number of Delays",
    hue = "Year"
)
g.set(xticks = [1, 12], xticklabels = ["Jan", "Dec"], xlabel = "")
How many people attended Federal Day Schools?#
from IPython.display import IFrame
IFrame("https://indiandayschools.org/", 1200,1000)


Questions#
What is the provenance of the data used in the expert report?
How does this data relate to the original documents?
What were record retention policies of Day Schools?
If we don’t know the data’s provenance then it’s not possible to assess the reliability of the total number of people that attended Day School from this data.