Class 5: Statistical variables, distributions, life history and conservation#
EEB 125#
Today’s data story:#
Are mammals that take longer to grow up at greater risk of extinction?#
Read in maturation data#
How long does each species usually take to grow to maturity?
Measured in days
file = open("maturity.csv")
lines = file.readlines()
header = lines[0]
data = lines[1:]
#print(header)
#print(data[1:4])
Read in IUCN data#
Extinction risk across mammalian speciecs
# get our data read in and prepped

iucn=open("iucn_status.csv")
iucn_lines = iucn.readlines()
iucn_header = iucn_lines[0]
iucn_data = iucn_lines[1:]
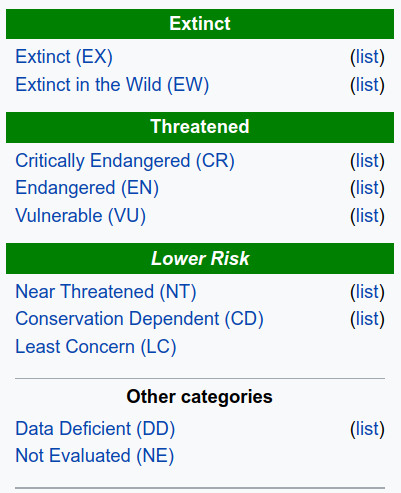
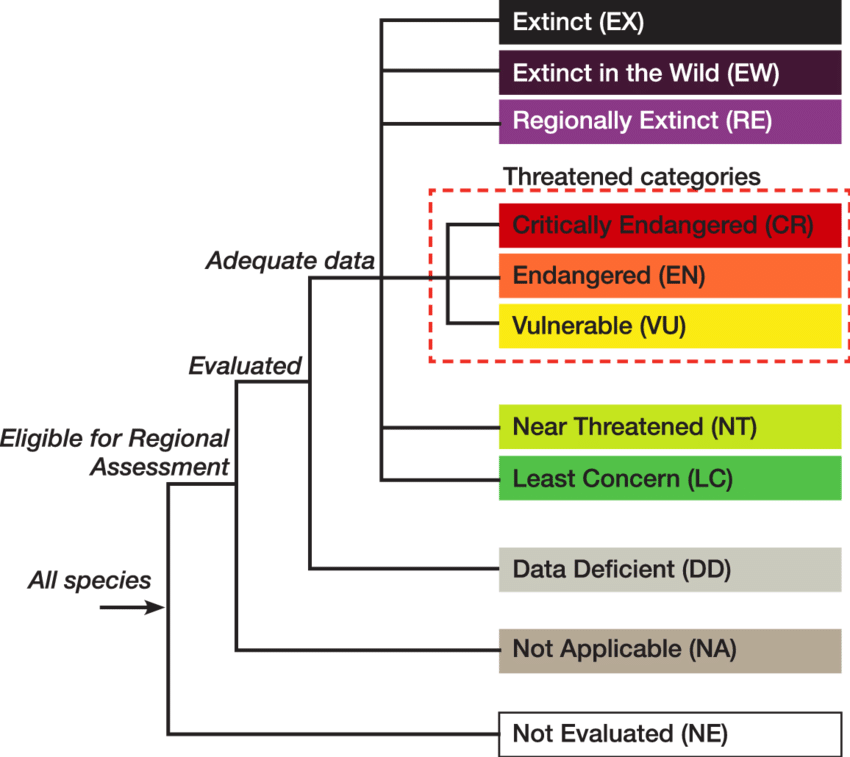
IUCN Red List#
To assess extinction risk, we will use IUCN status
IUCN is a conservation organization that manages information on threats to wild animals
IUCN Red List#
IUCN Red List#
We will need to combine information from both datasets to ask our question
print(iucn_header)
print(header)
Our approach:#
We will calculate the mean maturation time for all of the mammal species within a given risk category
Need to merge the two datasets by linking information for all the species shared between datasets
Setup both datasets#
Map the IUCN threat level to each species using a dictionary
sp_iucn = {}
for line in iucn_data:
    line_dat = line.strip().split(",")
    species = line_dat[1]
    iucn_risk = line_dat[2]
    sp_iucn[species] = iucn_risk
Setup both datasets#
Map maturation time to each species using a dictionary
sp_mat = {}
for line in data:
    line_dat = line.strip().split(",")
    species = line_dat[1]
    mat_time = line_dat[2]
    if mat_time != "NA":
        sp_mat[species] = float(mat_time) / 365 # convert to years
Linking things up#
We will want to calculate the mean maturation time for the species within each risk category
First, how can we find what unique risk categories exist in our dataset?
risk_cat = sp_iucn.values()
unique_risk_cat = set(risk_cat)
print(unique_risk_cat)
Getting setup#
create our container that links maturation times with IUCN risk level
we will want to store the maturation times associated with each level in a list
iucn_mat = {}
for cat in unique_risk_cat:
    iucn_mat[cat] = []
Link our two dictionaries to a third#
Both of our dictionaries,
sp_matandsp_iucnhave species names as the keysWe can use the keys of one to look up the values from the other
We then need to add values to our third dictionary,
iucn_mat
Dictionary overload#
sp_mat: keys = species name, values = maturation timesp_iucn: keys = species name, values = iucn risk leveliucn_mat: keys = iucn risk level, values = empty list (to be populated with maturation times)
The approach (in English)#
iterate through
sp_matkeys are species, values are maturation time
look up the IUCN risk level stored in
sp_iucnusing the keys we are iterating overpopulate the lists associated with each key in
iucn_mat
for sp in sp_mat:
    mat = sp_mat[sp]
    try:
        iucn_cat = sp_iucn[sp]           ##
        iucn_mat[iucn_cat].append(mat)
    except:
        continue
Calculate means#
loop through iucn_mat and calculate the mean for each risk level
# let's calculate a function that does this
def mean(pop):
    tot = 0
    for i in pop:
        tot += i
    mean = tot / len(pop)
    return mean
iucn_means = {}

for cat in iucn_mat:
    mat_times = iucn_mat[cat]
    if len(mat_times)>0:
        cat_mean = mean(mat_times)
        iucn_means[cat] = cat_mean
for cat in iucn_means:
    print(cat, iucn_means[cat])
What categories should we consider ‘at risk’?#
What categories should we consider ‘at risk’?#
We will say anything above level 2 is “at risk”, while anything below is not.
iucn_map={'LC':1,'NT':2,'VU':3,'EN':4,'CR':5,'EW':6,'EX':7,'DD':0}
Mark species at risk, or not at risk#
We will say anything above level 2 is “at risk”, while anything below is not.
sp_threat = {}
for line in iucn_data:
    line_dat = line.strip().split(",")
    species = line_dat[1]
    iucn_risk = line_dat[2]
    risk_numeric = iucn_map[iucn_risk]
    threat = False
    if risk_numeric > 2:
        threat = True
    elif risk_numeric == 0:
        continue
    sp_threat[species] = threat
Our approach:#
We will calculate the mean maturation time for all at risk, vs not at risk mammals
Setup both datasets#
Map maturation time to each species using a dictionary
sp_mat = {}
for line in data:
    line_dat = line.strip().split(",")
    species = line_dat[1]
    mat_time = line_dat[2]
    if mat_time != "NA":
        sp_mat[species] = float(mat_time) / 365 # convert to years
Link our two dictionaries to a third#
Both of our dictionaries,
sp_matandsp_iucnhave species names as the keysWe can use the keys of one to look up the values from the other
We then need to add values to a third dictionary,
threat_mat
threat_mat={True:[],False:[]}
Dictionary overload#
sp_mat: keys = species name, values = maturation timesp_iucn: keys = species name, values = iucn risk levelthreat_mat: keys = threat, values = empty list (to be populated with maturation times)
The approach (in English)#
iterate through
sp_matkeys are species, values are maturation time
look up the IUCN risk level stored in
sp_iucnusing the keys we are iterating overpopulate the lists associated with each key in
threat_mat
for sp in sp_mat:
    mat = sp_mat[sp]
    try:
        threat = sp_threat[sp]
        threat_mat[threat].append(mat)
    except:
        continue
print(threat_mat)
Calculate means#
loop through iucn_mat and calculate the mean for threatened vs non-threatened species
threat_means = {}

for threat in threat_mat:
    mat_times = threat_mat[threat]
    threat_mean = mean(mat_times)
    threat_means[threat] = threat_mean

print(threat_means)
Today’s data story:#
Are mammals that take longer to grow up at greater risk of extinction?#
Today’s data story:#
Are mammals that take longer to grow up at greater risk of extinction?#
Possibly? We will learn more sophisticated statistical techniques later to examine questions like this more closely
Statistical Distributions#
What is a statistical distribution?
How can a distribution be summarized?
What questions can we answer using a distribution?
What is the distribution of conservation risk across mammals?#
How many species belong to each category?
# create two lists, one that will be the keys and another that will be values
keys = list(iucn_map.keys())
vals = [0 for i in range(len(keys))]   #  we will tally species counts for each iucn level later

# wrap the two lists together into a single dictionary
iucn_counts = dict(zip(keys,vals))
print(iucn_counts)
What is the distribution of conservation risk across mammals?#
for line in iucn_data:
    line_dat = line.strip().split(",")
    iucn_risk = line_dat[2]
    iucn_counts[iucn_risk]+=1
What is the distribution of conservation risk across mammals?#
print(iucn_counts)
Importing modules#
There are often times where something we want to do is so common that someone has already written code that does it
These are packeged in the form of python ‘modules’
We need to import these modules to use this code
We will use one for plotting data called matplotlib
(you will not need to do this yourself yet– just watch for now)
import matplotlib.pyplot as plt
What is the distribution of conservation risk across mammals?#
The bars represent the frequency of observations and the labels on the horizontal axis represent the number of species at a conservation risk level.
This is called the frequency distribution of conservation risk.
What is the distribution of conservation risk across mammals?#
rel_counts = [i/sum(iucn_counts.values()) for i in iucn_counts.values()]
plt.bar(iucn_counts.keys(),rel_counts)
plt.show()
If we want to plot proportions instead of counts then we can transform
activity_distby dividing by the total number of observations.This is called the relative frequency distribution of activity.
Q: About what proportion of mammals is at risk?
rel_counts = [i/sum(iucn_counts.values()) for i in iucn_counts.values()]
plt.bar(iucn_counts.keys(),rel_counts)
plt.show()
Summarizing the distribution of a continuous variable#
What is the distribution of the time it takes to grow up across mammals?#
Variation#
One of the most important concepts in statistics and biology
Standard deviation is average deviation from the mean
Large values mean lots of variation and small values mean less variation.
Other measures of variation also exist (e.g., the range– max - min)
Variance#
How far from the mean are the data, on average?
Calculate the difference between each data point and the mean
Calculate the mean of these differences
def variance(data,mean_val):
    diffs=[]
    for i in data:
        diff = i - mean_val
        sq_diff = diff ** 2
        diffs.append(sq_diff)
    var = mean(diffs)
    return var
Standard Deviation#
Square root of the variance
Descibes the variation in values, expressed in the same units as the data
import math

def st_dev(data,mean_val):
    var = variance(data,mean_val)
    sd = math.sqrt(var)
    return sd
Calculate means#
loop through iucn_mat and calculate the mean for each risk level
threat_sds = {}

for threat in threat_mat:
    mat_times = threat_mat[threat]
    threat_mean = threat_means[threat]
    threat_sd = st_dev(mat_times,threat_mean)
    threat_sds[threat] = threat_sd
threat_sds
for threat in threat_means:
    threat_mean = threat_means[threat]
    threat_sd = threat_sds[threat]
    print(threat,threat_mean,threat_sd)
Histograms#
We can also visualize central tendency and variation using a type of plot called a histogram
plt.hist(sp_mat.values())
plt.show()
Histograms#
We can also visualize the relative frequency, or proportion of individuals with each maturation time
plt.hist(sp_mat.values(),density=True)
plt.show()
Histograms#
Histograms can be useful to visualize differences in how data are distributed
plt.hist(threat_mat[False],density=True,alpha=0.5,label="not at risk")
plt.hist(threat_mat[True],density=True,alpha=0.5,label="at risk")
plt.legend(loc='upper right')
plt.xlabel("maturation time (years)")
plt.show()
Midterm#
Computer-based
Will take place in this classroom at our normal lecture time
Feb. 12, 1pm-3pm
Format#
Mix of:
(simple) programming exercises (i.e., produce your own code)
code reading/interpretation (i.e., explain some pre-written code)
data interpretation (i.e., look at some data summaries and interpret them)
Will be largely similar to the structure of a homework assignment